
The renewable energy intelligence platform
Harness more than 200 GW of anonymized wind and solar asset data, advanced AI and industry expertise. Clir's intelligence platform provides actionable insights to maximize returns, minimize risks and optimize commercial performance.

200+ GW of data
Clir’s global dataset consists of operational reports, contracts, industry studies, SCADA data, user entered events, weather data, insurance data and much more. This gives Clir the most in-depth view of renewable energy asset performance.
Advanced artificial intelligence
Clir’s proprietary data model uses machine learning and large language models to cleanse, label and enhance data from disparate sources. This foundation of quality data drives reliable insights.
Industry expertise
By combining technical expertise in wind and solar with data scientists and software development professionals, Clir develops best-in-class solutions that identify opportunities for revenue, cost and risk optimization.

Technology and data to maximize portfolio value
Evaluate portfolio performance in an industry context. Clir aggregates and analyzes millions of data points, comparing KPIs to peer and industry benchmarks, to equip stakeholders with invaluable intelligence. Improve returns with actionable insights, best-in-class risk mitigations, and technical and financial optimization strategies.

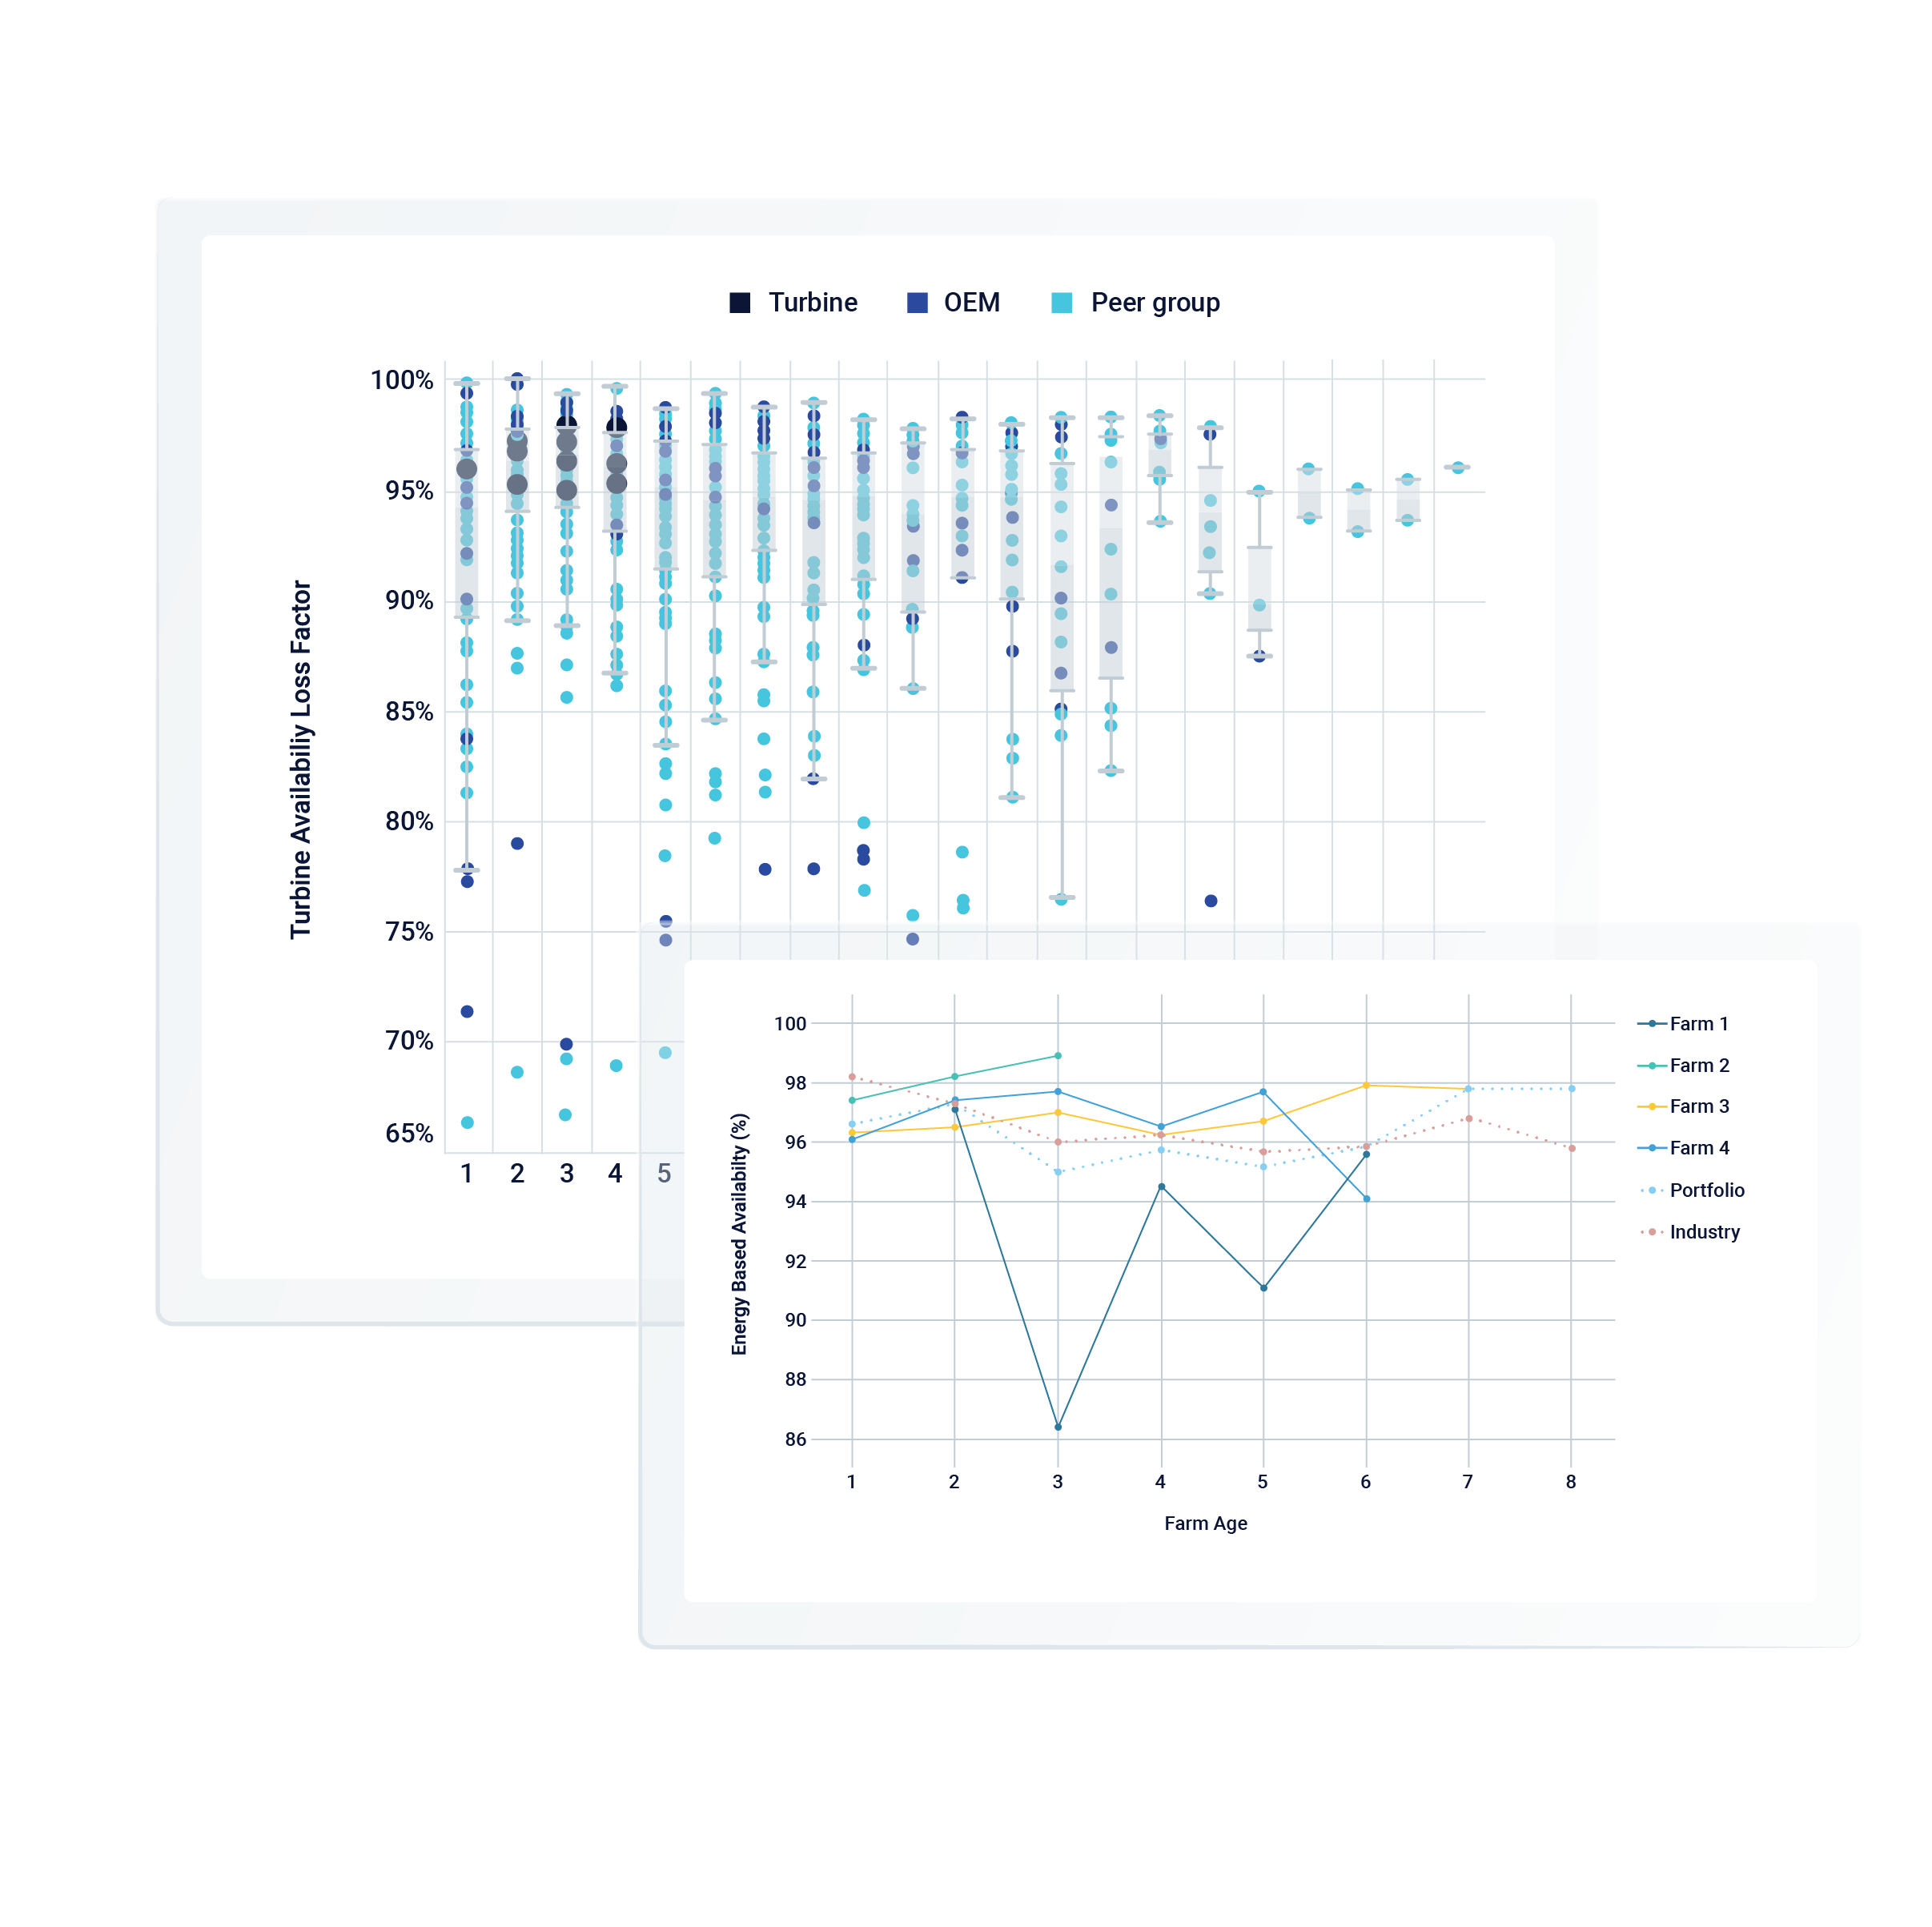
Improve energy yield assessments with loss insights
Clir models potential performance by measuring portfolio loss factors against peer groups, based on region, technology, service provider and more. Uncover where your farm underperforms compared to peers and unlock opportunities to enhance energy production.

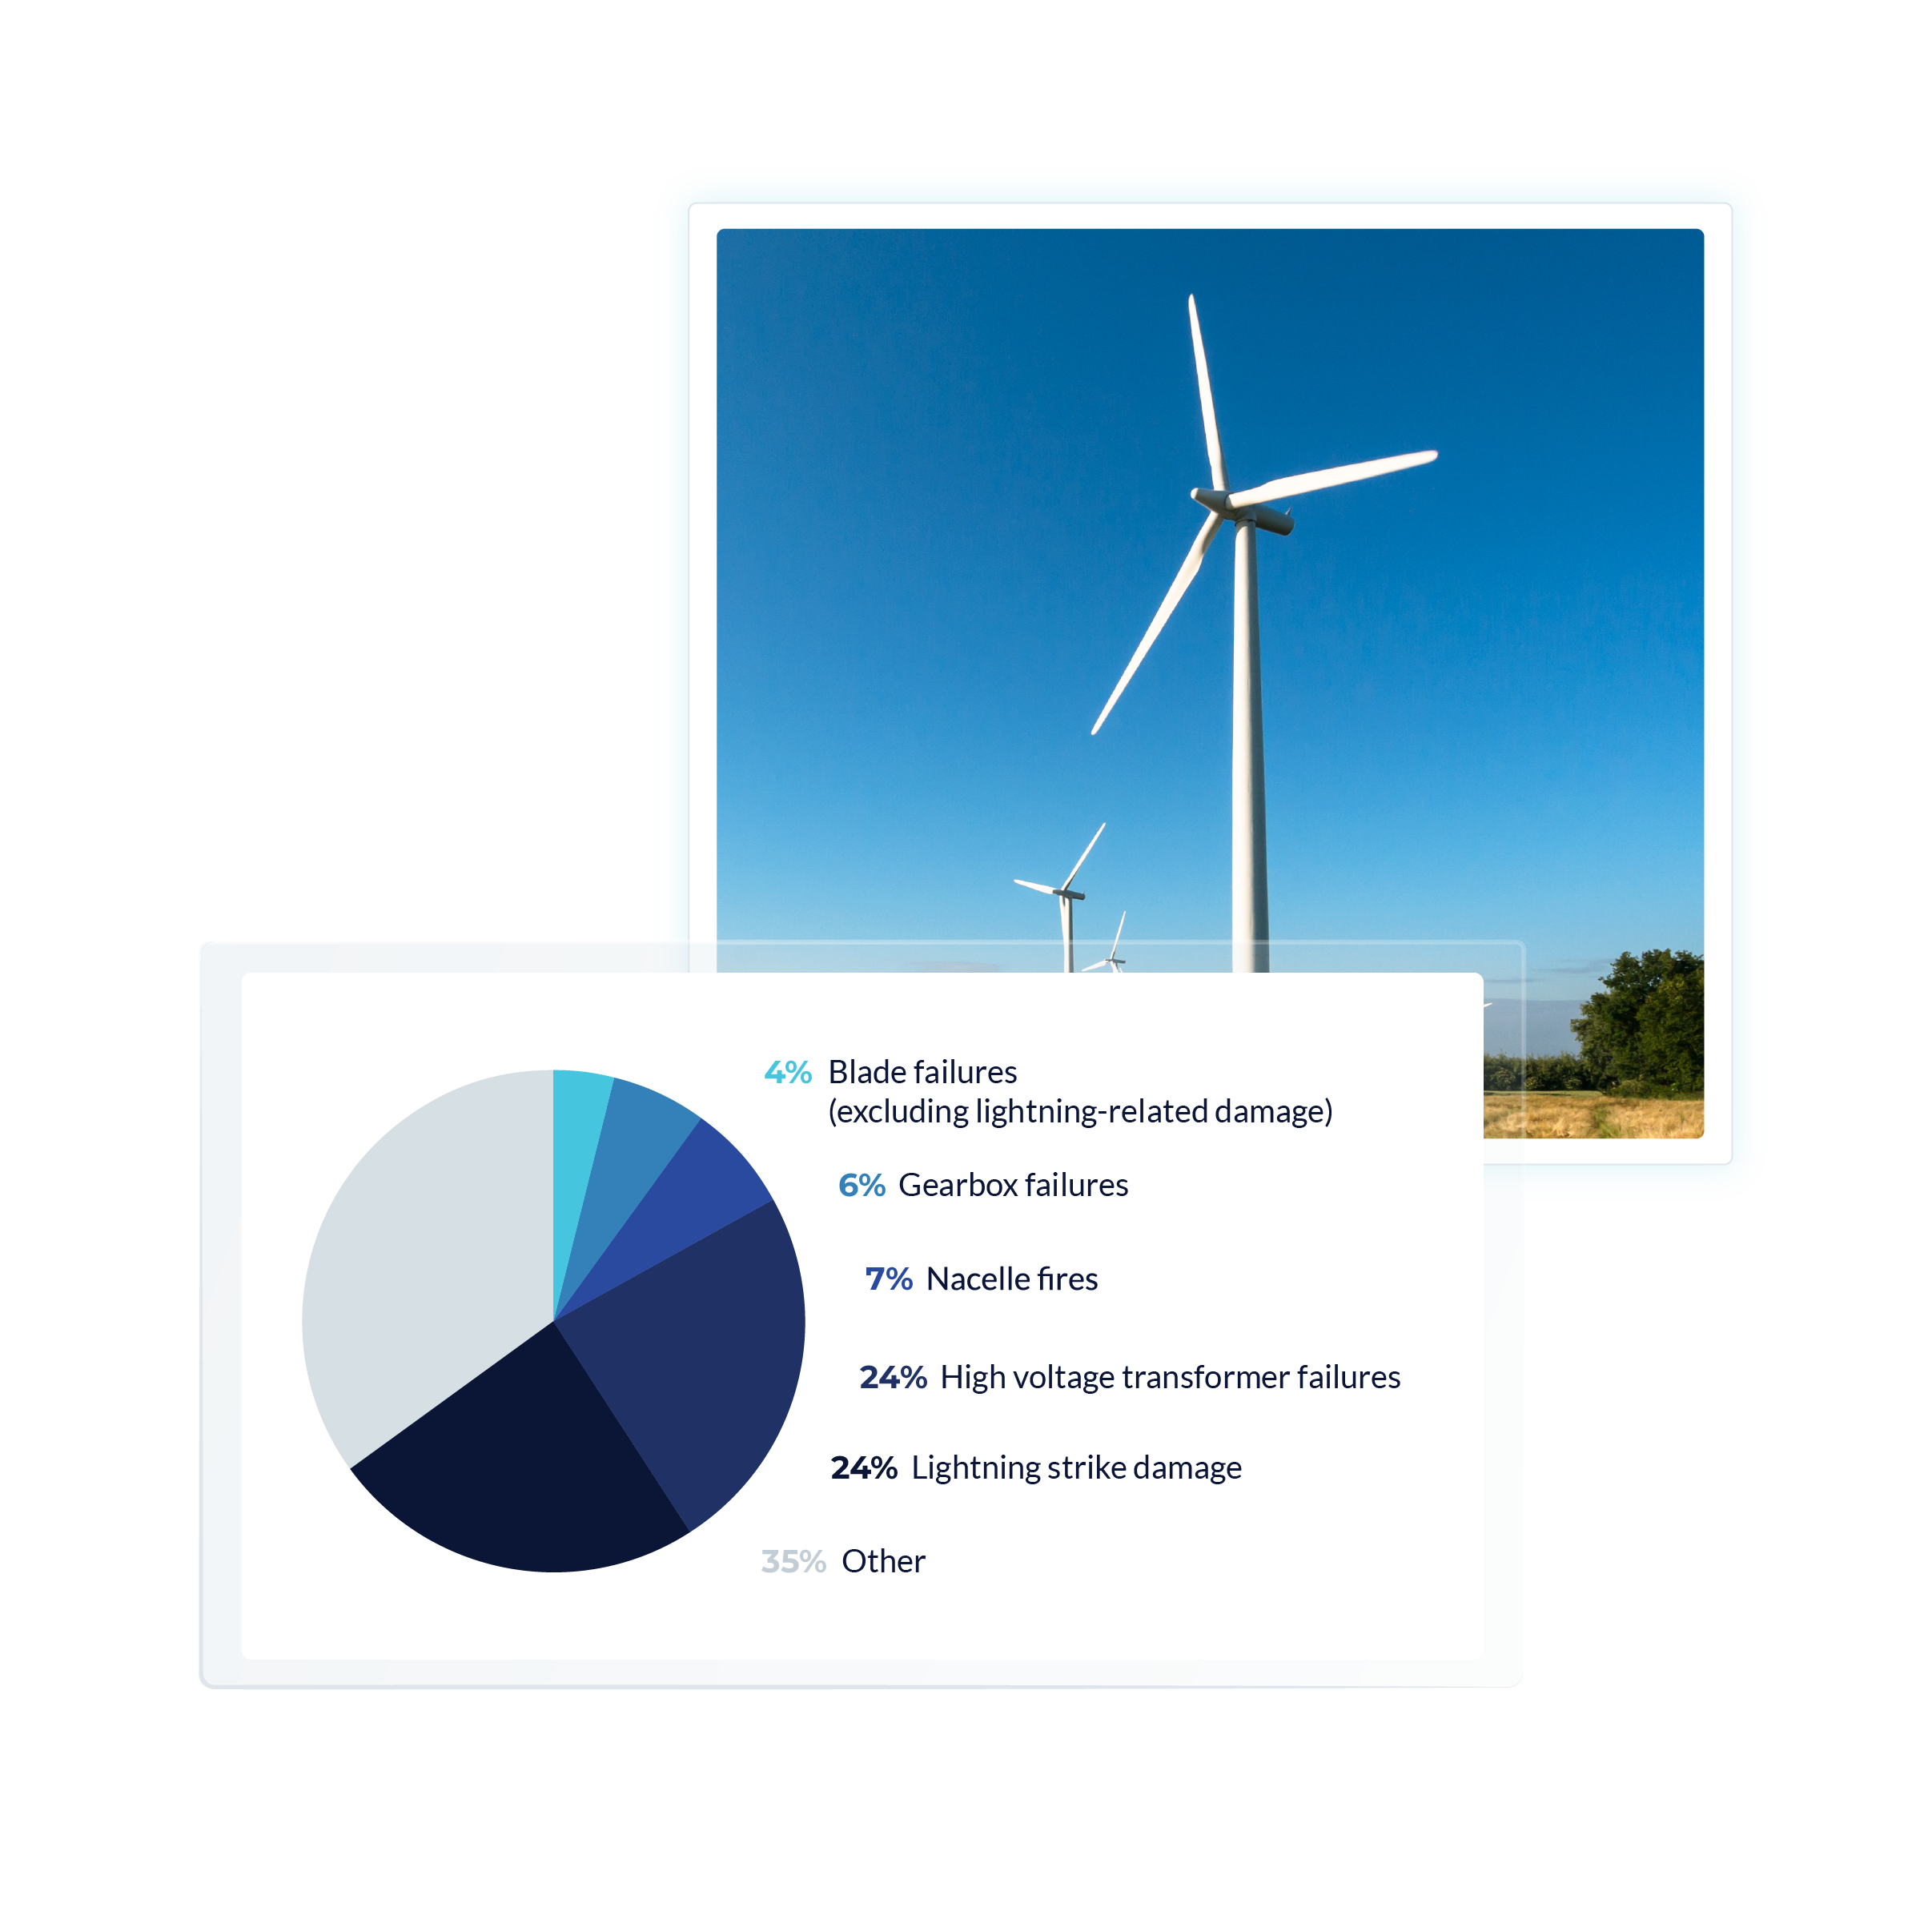
Deeper health and risk insights
Use industry technology risk and failure data to gain unparalleled insights into portfolio risk management. Identify major asset risks, potential gains, and the technical and contractual work needed to improve asset health.
Unlock production potential
With access to better data, industry benchmarks and in-depth analysis, owners can identify areas where portfolio production can be increased. Leverage industry best-practices for a roadmap to improve asset performance.

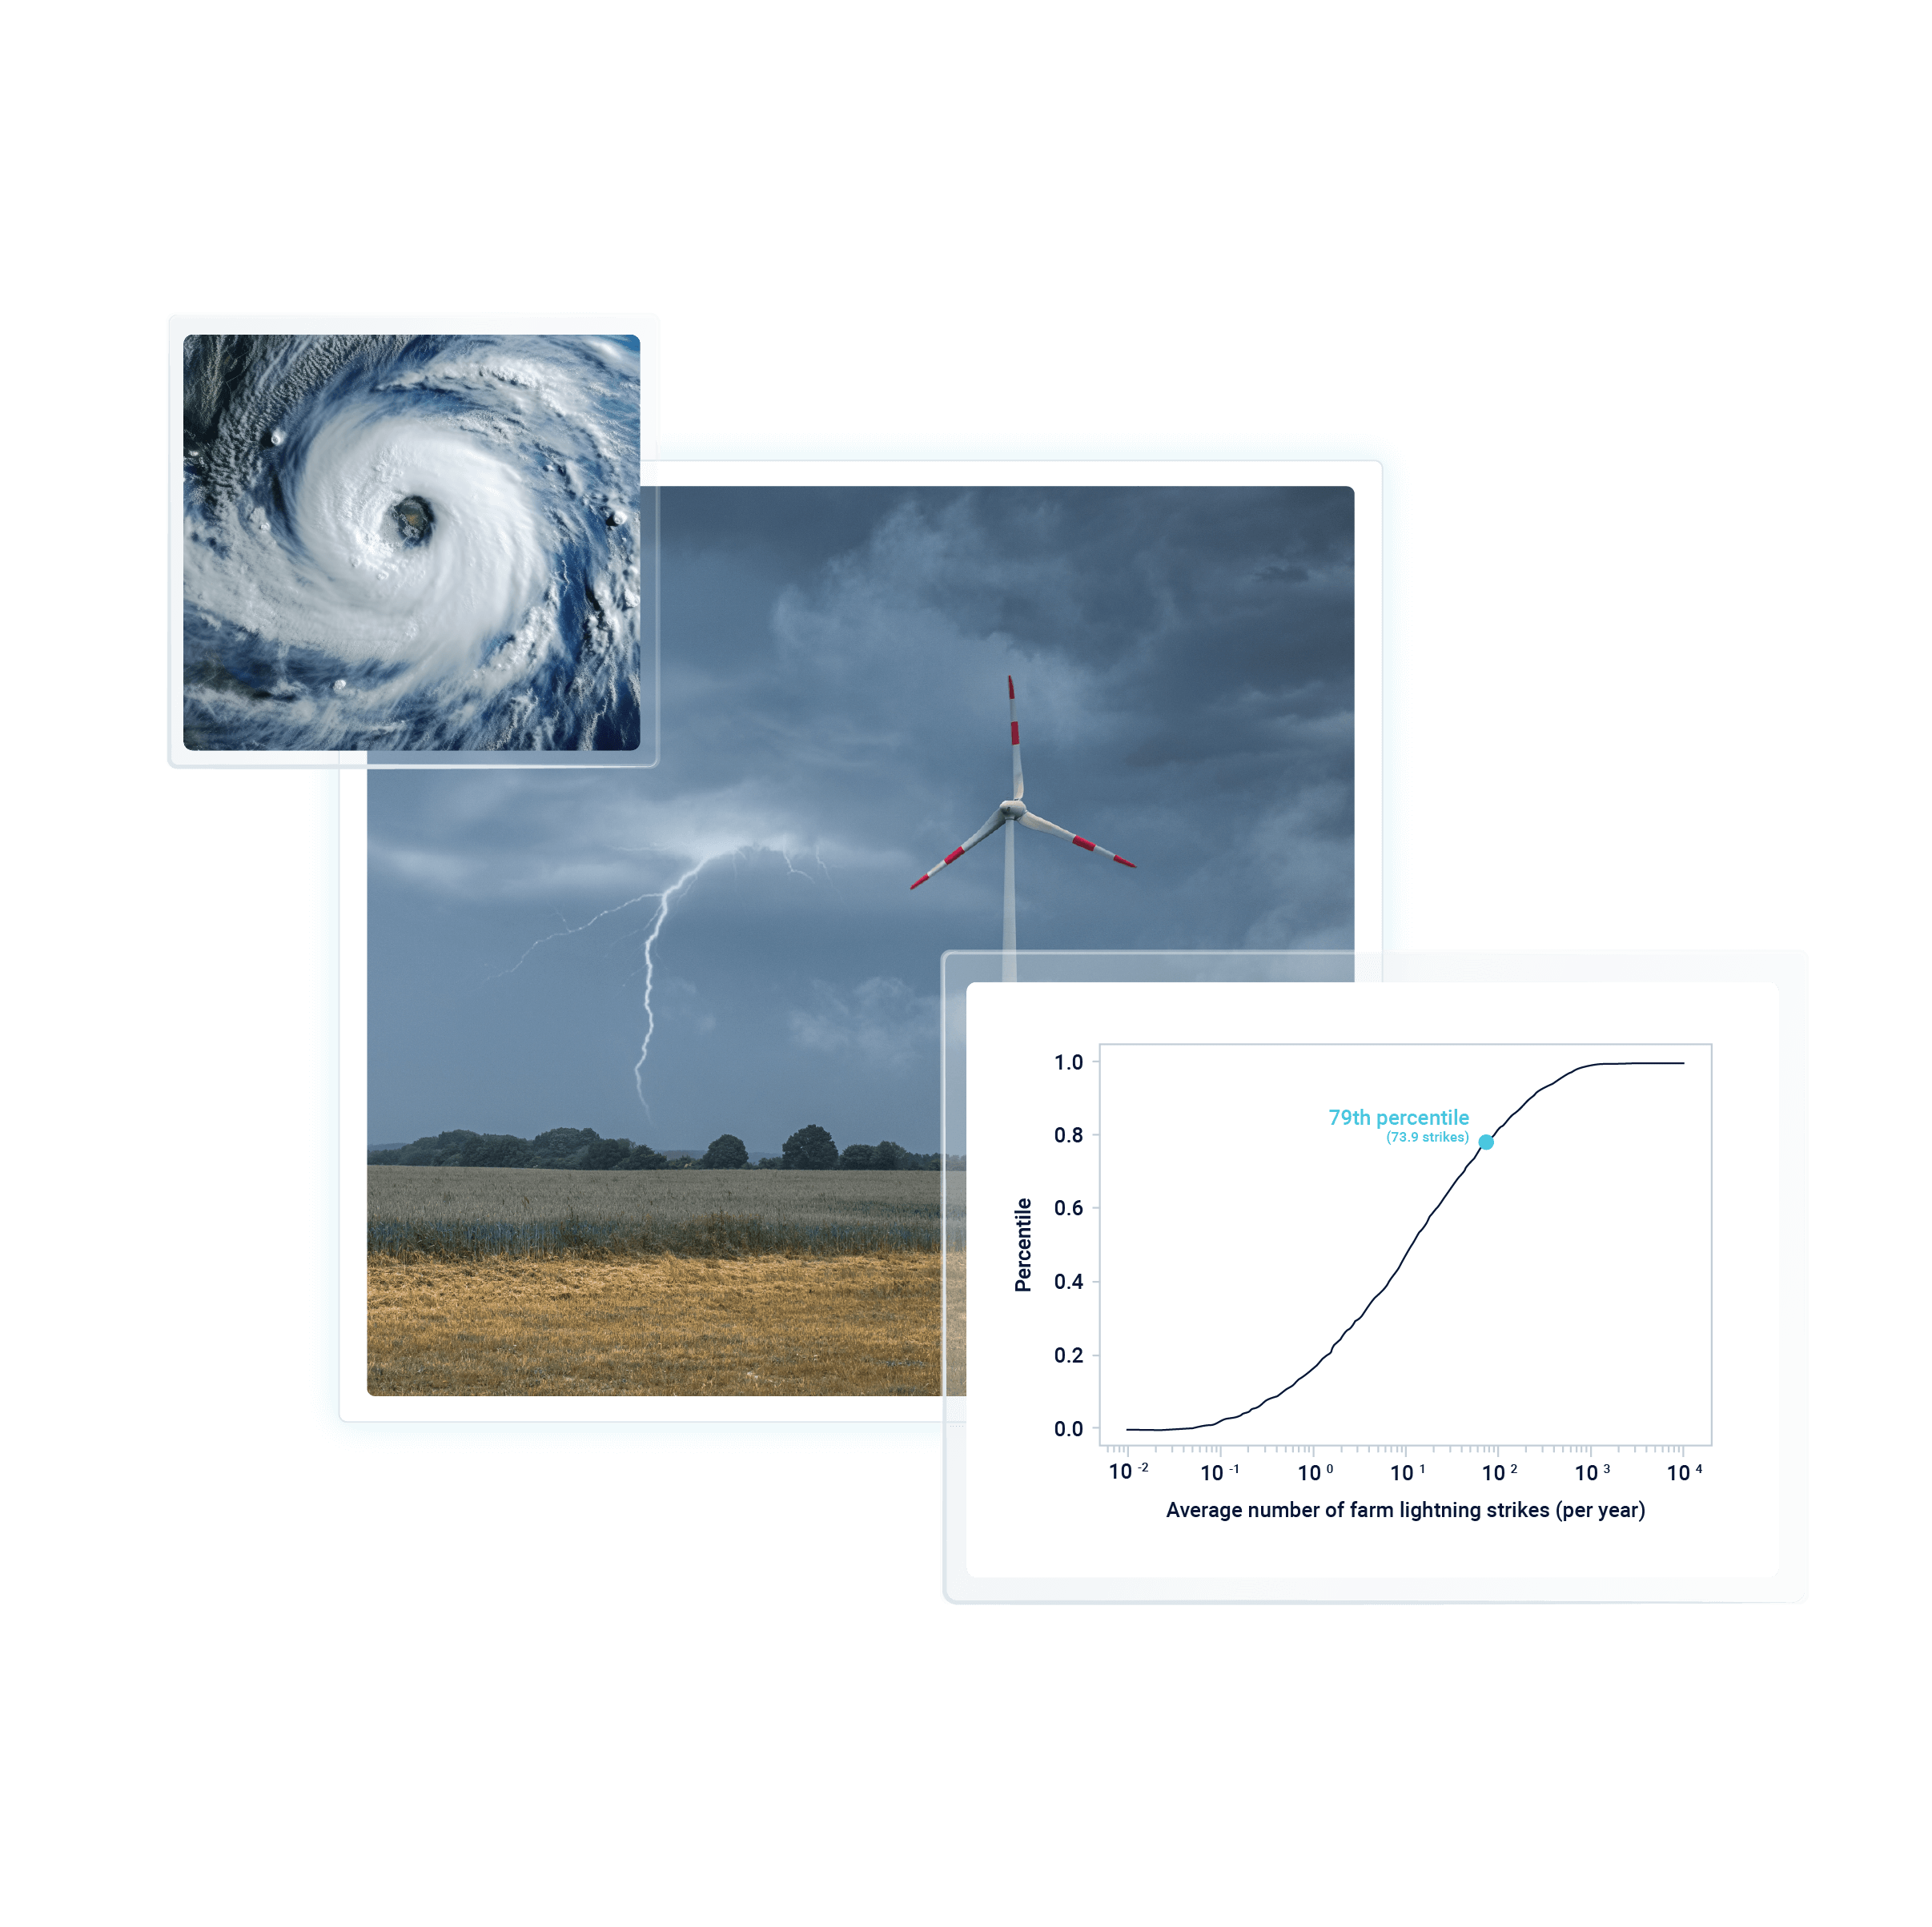
Mitigate natural catastrophe damage
Understand how natural catastrophes will impact your portfolio. Clir's data on exposure to tropical cyclones, lightning, hail and extreme wind risk helps owners understand and mitigate potentially catastrophic issues from extreme weather.
New platform features
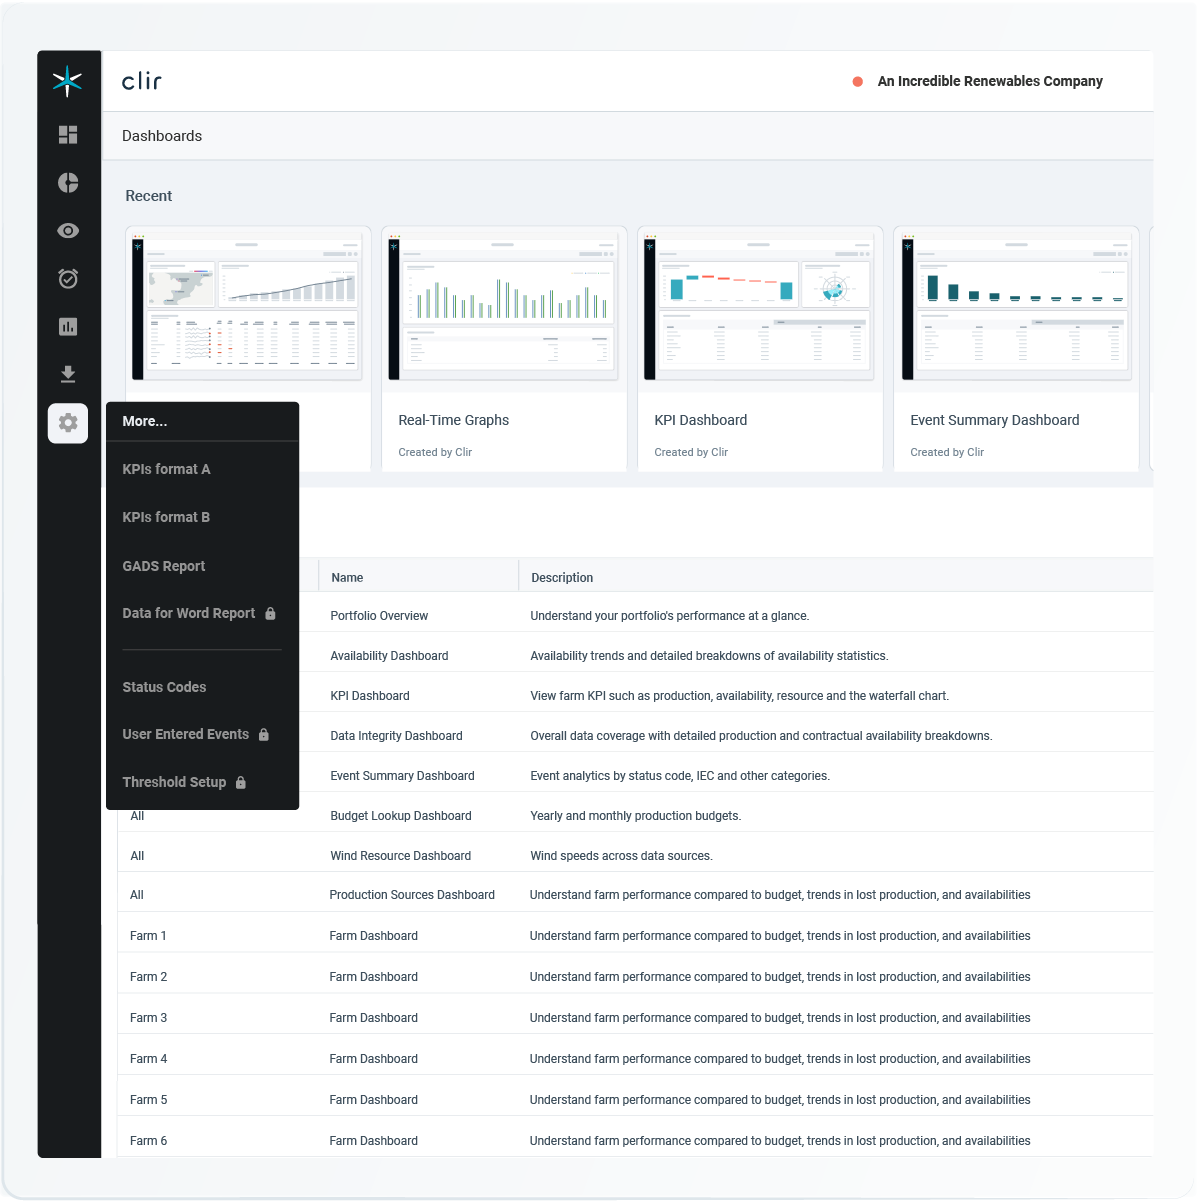
New app experience
Improved data visualization, customizable dashboards and a streamlined user experience will make finding insights about your portfolio easier than ever.
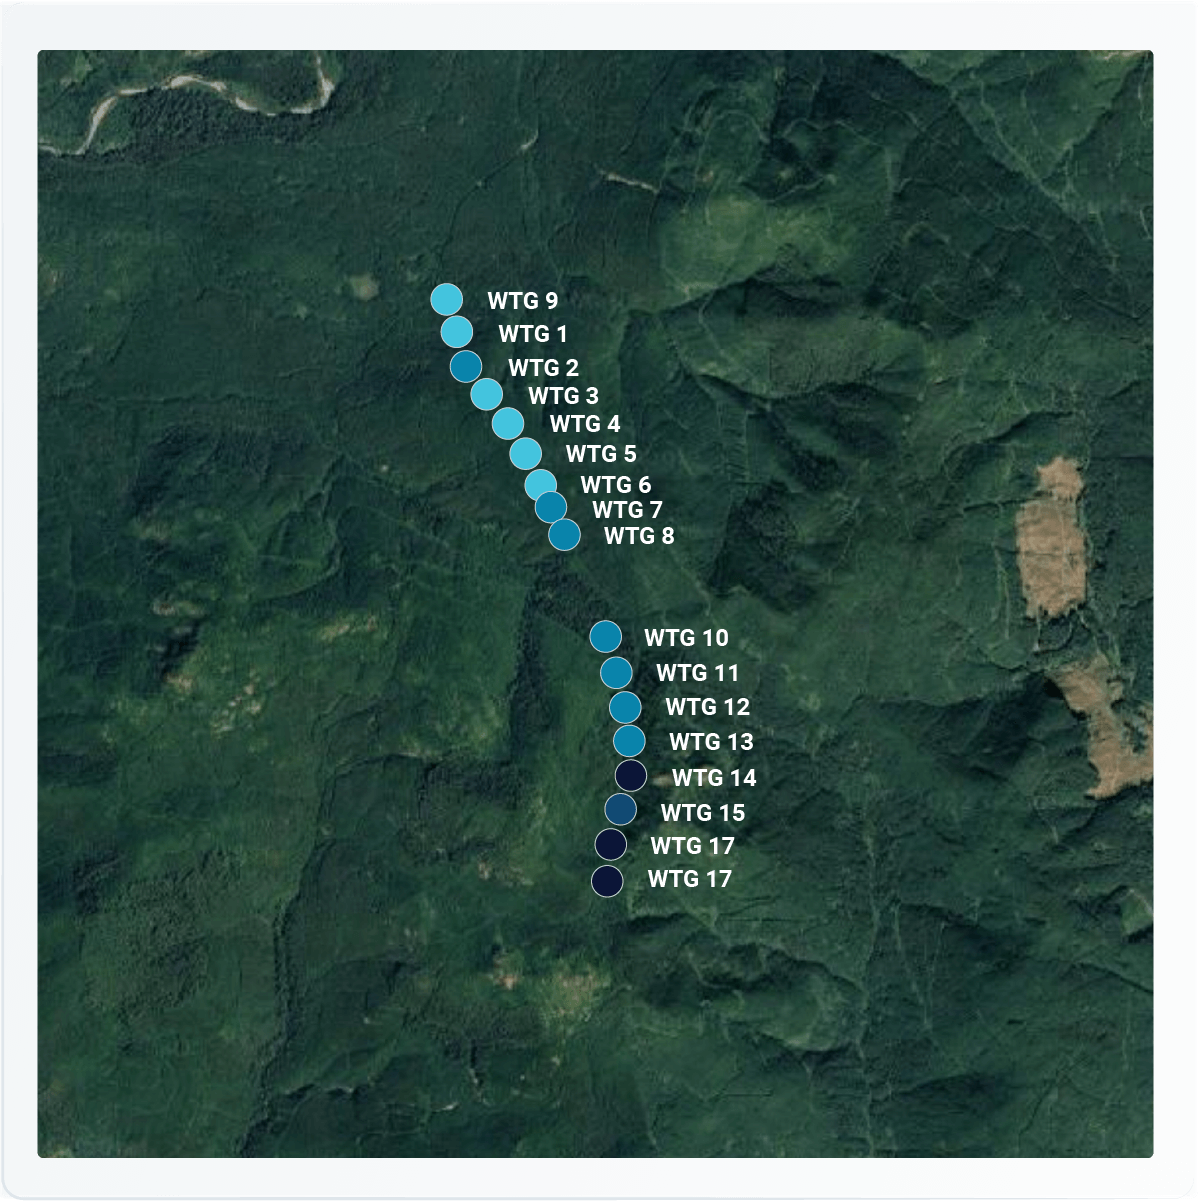
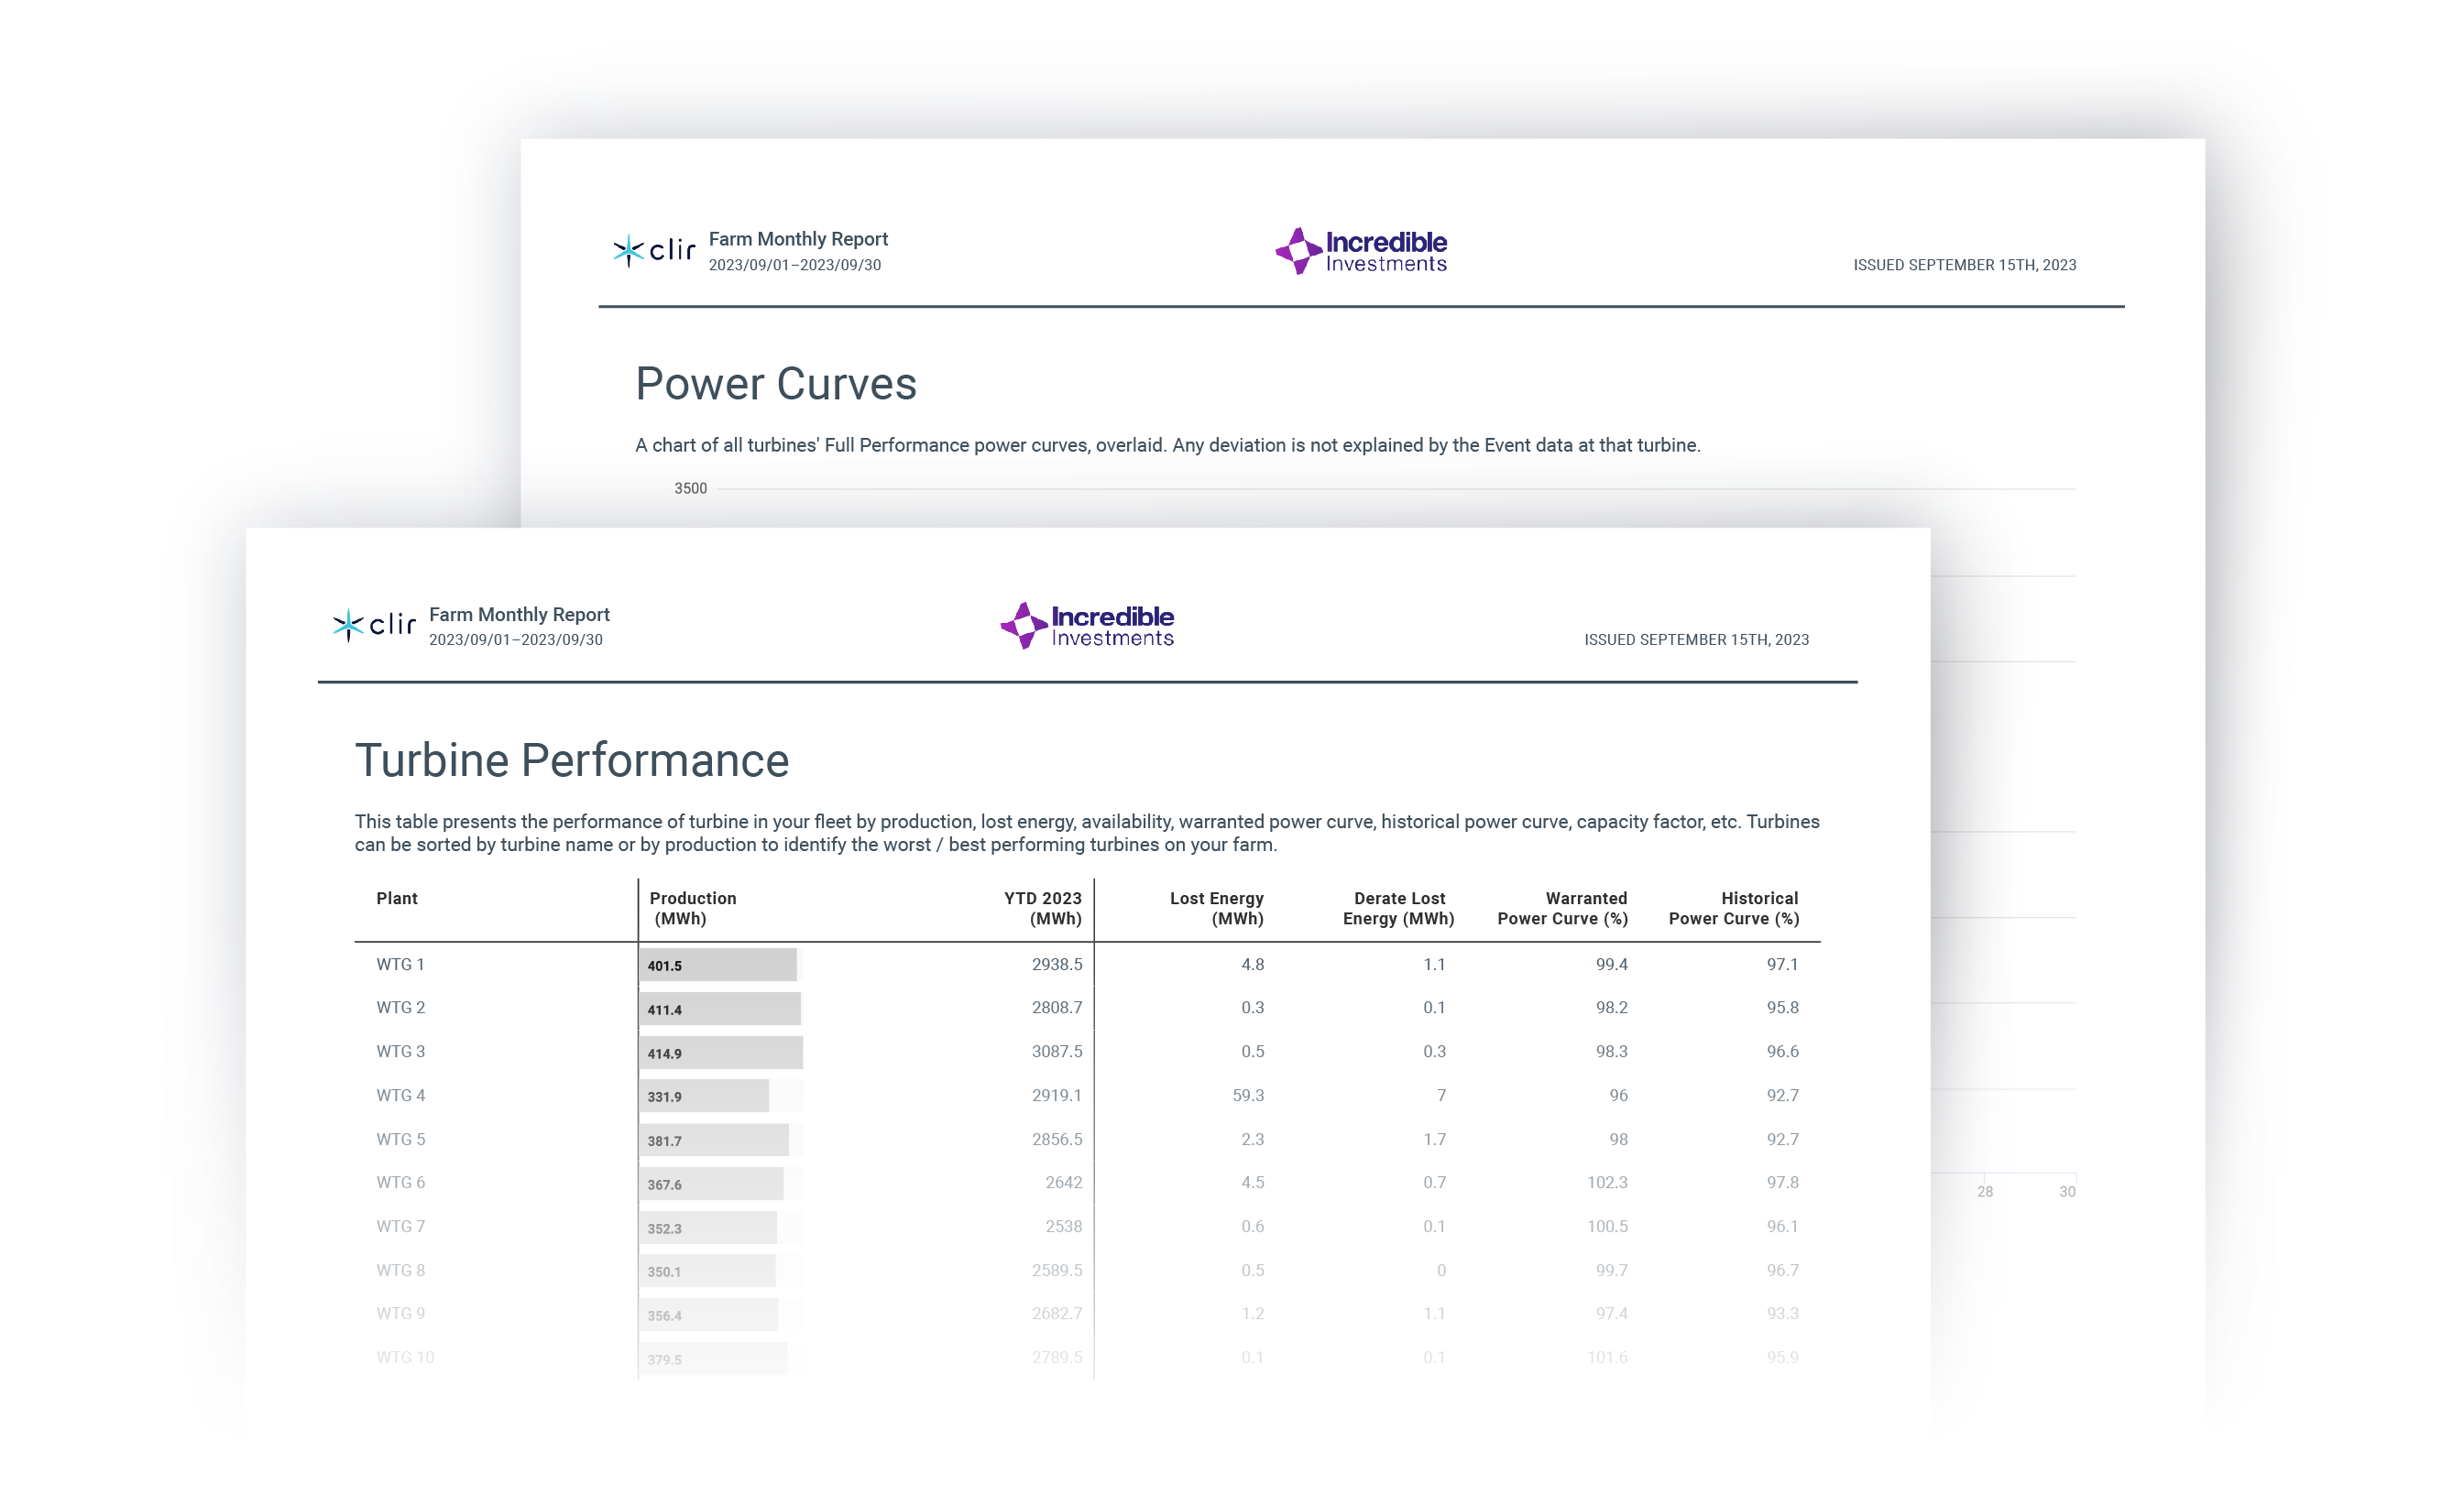
Portfolio level reporting
Gain high-level insights into the performance of your portfolio through intuitive visualizations. Further enables farm-level reporting via the geobubble and actions widgets.
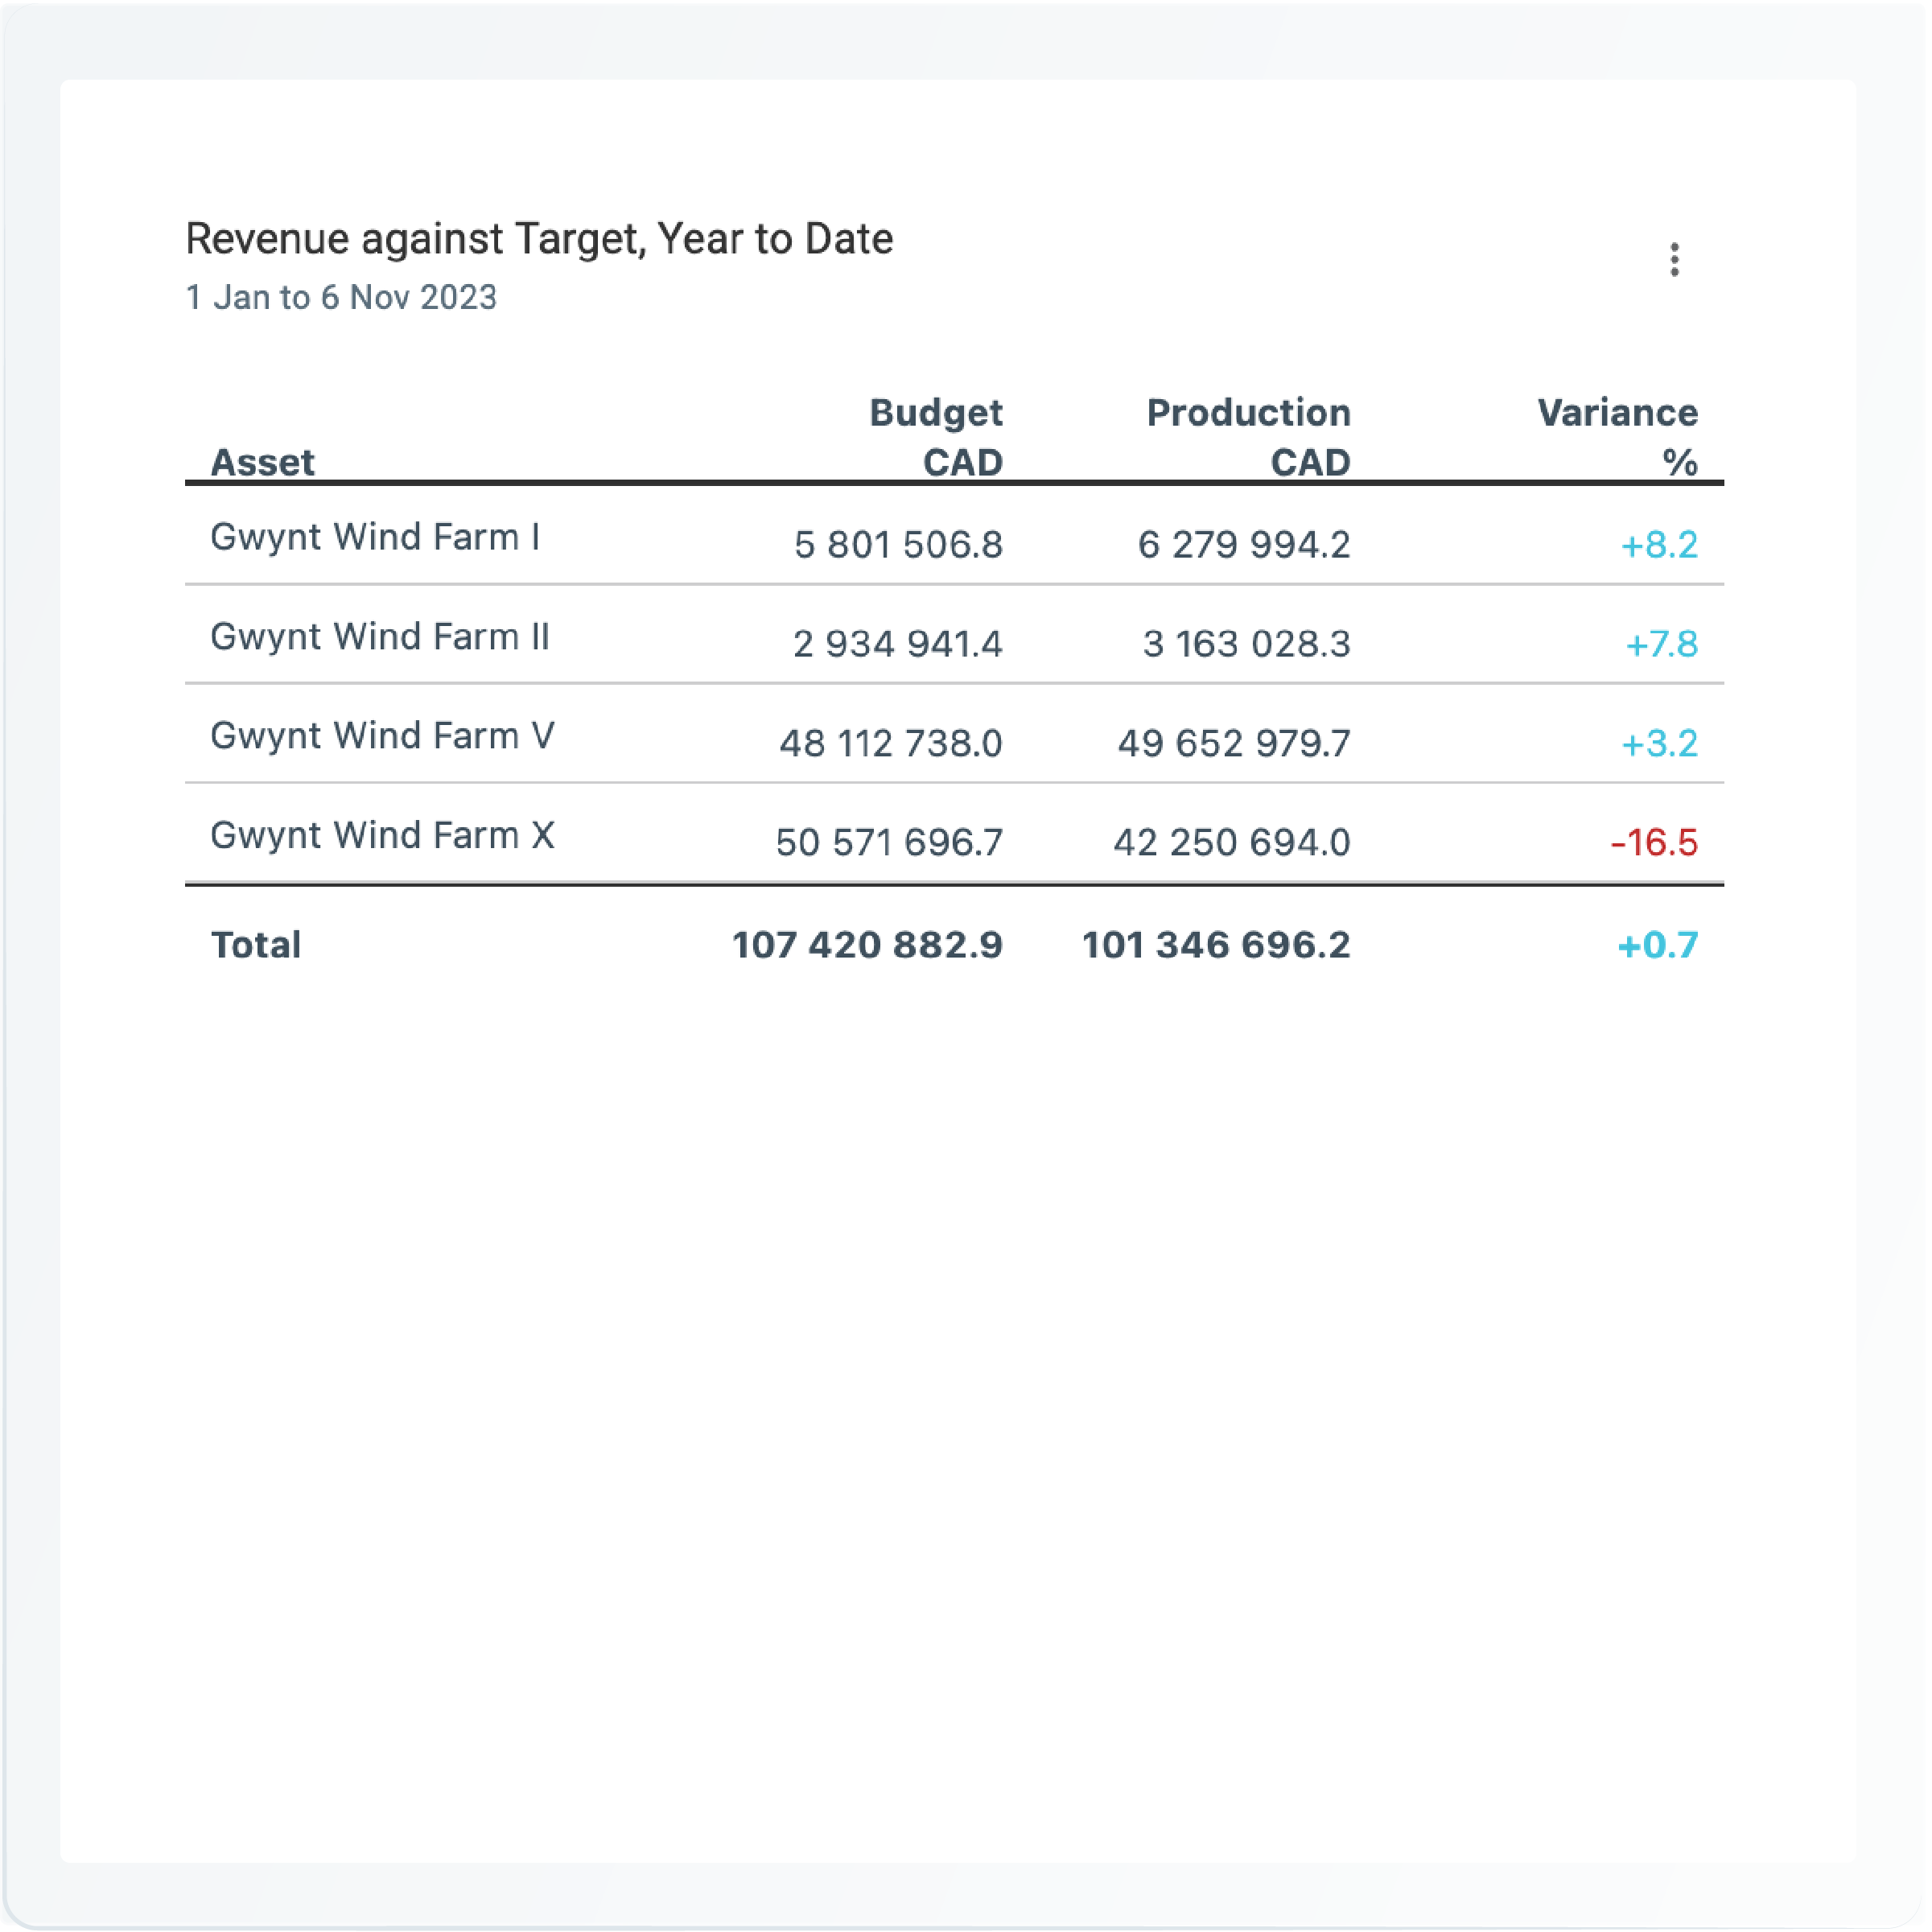
Currency KPIs
A snapshot of how your farm is producing against financial forecasts. Users on the Clir app can now analyze their production against budget in any currency they choose.