
Independent Intelligence for Wind Portfolios
Clir Renewables, built on 350+ GW of wind, solar and BESS globally, standardizes every turbine, OEM and site into one data model, then puts AI to work on reporting, availability reconciliation, performance recovery and budgets.

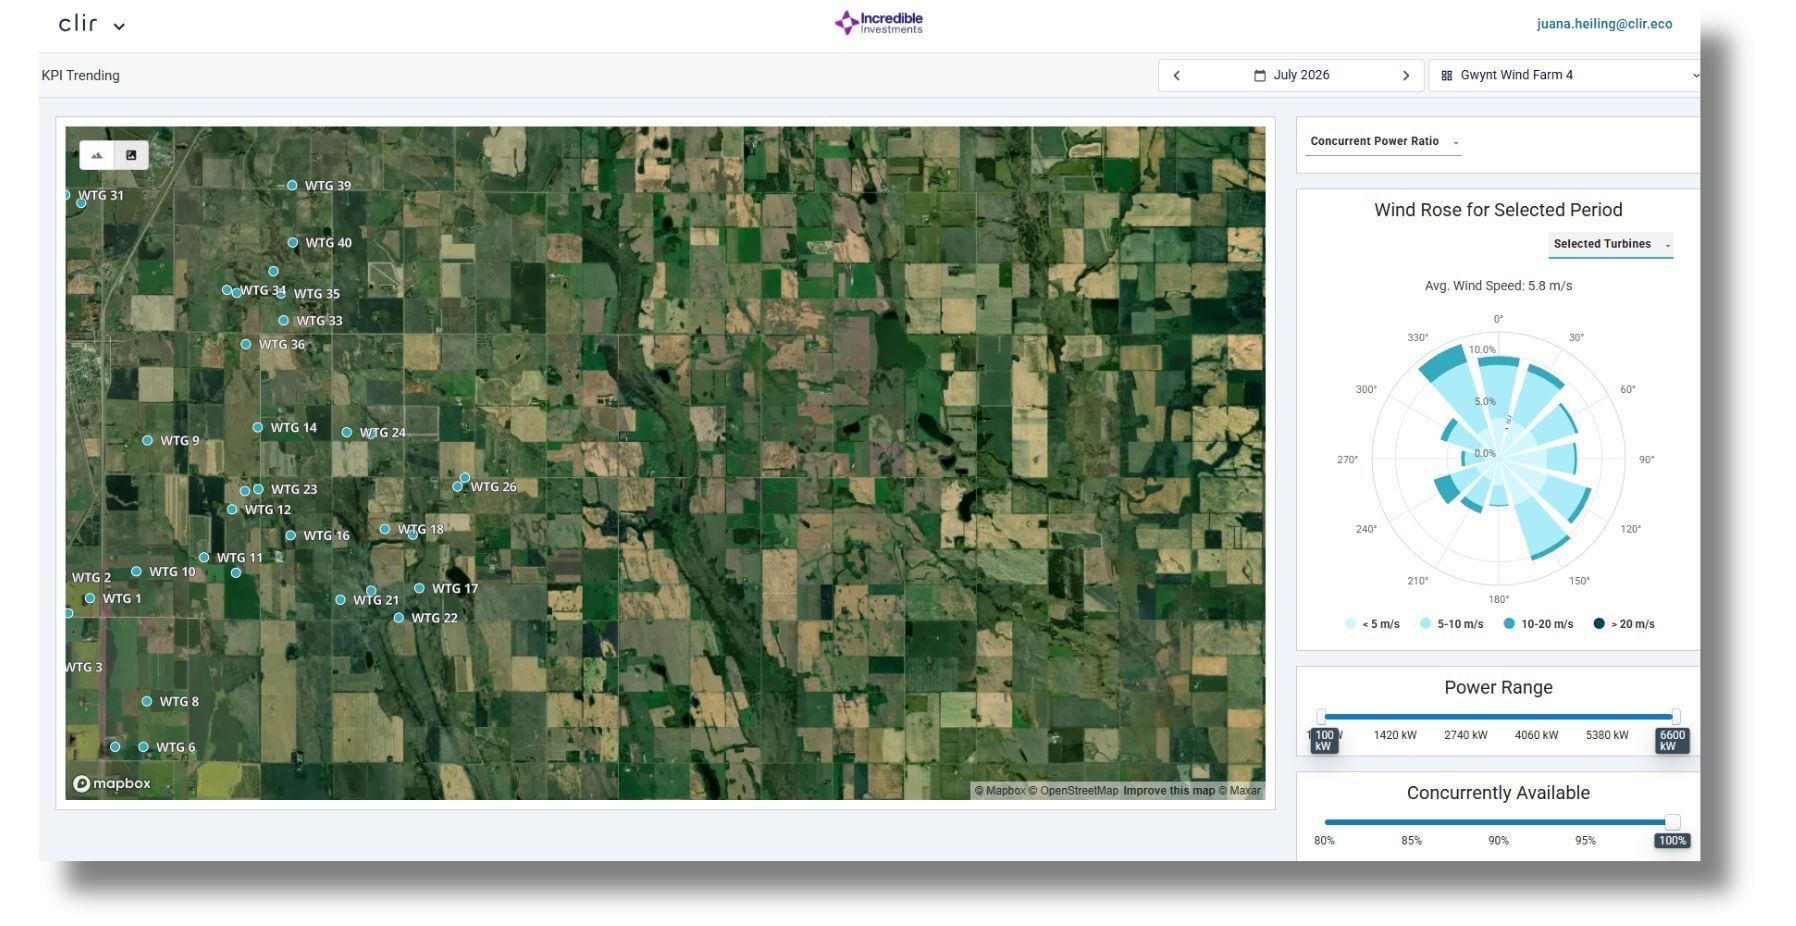
Why OEM Reporting Leaves Wind Owners Exposed
Multi-OEM portfolios mean multiple data definitions, multiple availability calculations and multiple versions of the truth. The party calculating your contractual availability is usually the party being measured by it.
You are overseeing availability figures calculated by the same OEM that's measured on them, a conflict of interest baked into the reporting. Underneath sits underperformance from yaw misalignment, pitch faults, derates and icing that SCADA alone never explains, spread across turbine fleets whose inconsistent data models make comparison between turbines and sites unreliable. So budget misses get described but never defensibly attributed.
Owners lose real money in the gap between OEM reporting and operational reality. Clir gives you an independent record of both.
What Wind Owners Get From Clir’s AI Platform
- Recover availability the OEM reported away. Independent reconciliation compressed from weeks to days.
- Find the energy hiding in the power curve. 4,200 MWh per year uncovered across a multi-site wind portfolio.
- Cut losses before they compound. Derates reduced by 50% and 300 MWh saved through early component fault detection.
- Every major OEM and model, onshore and offshore. 350+ GW benchmarked in one data model.

Investor Grade Portfolio Reporting for Wind Farms
Budget, production, forecasted P50, resource variance and energy availability for every farm in one table, standalone or alongside solar and BESS, with major losses attributed by the responsible party: service provider, owner, balance of plant, environment or utility. Board-ready outputs replace the monthly deck-build. Ask your AI assistant why a farm missed budget and get an answer grounded in live Clir data.
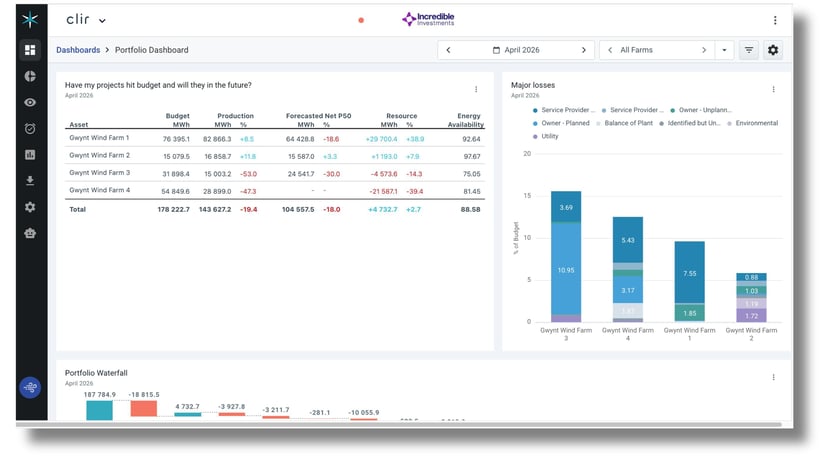
Which assets missed budget, by how much and whose loss it was, in one view.
Wind Portfolio Performance Monitoring
Clir's proprietary AI data model and automated anomaly detection run continuously across power curve deviation, dynamic yaw, blade pitch, derates, icing and component health, with each loss classified against IEC categories and quantified in energy and revenue. Real-time turbine status, power curve analytics and fleet-wide availability heatmaps catch underperformance early, and benchmarking against 350+ GW of wind, solar and BESS tells you whether a problem is yours or the industry's.
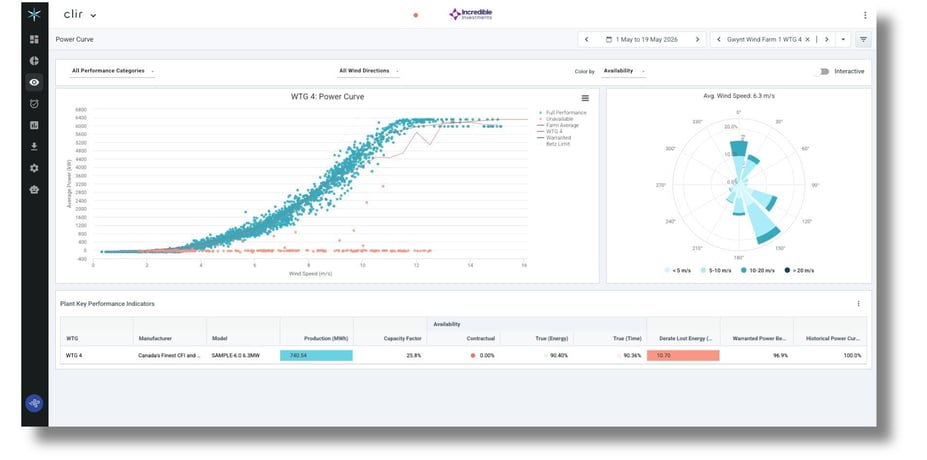
Every operating interval plotted against the warranted curve, with underperformance colored and derate losses quantified per turbine.
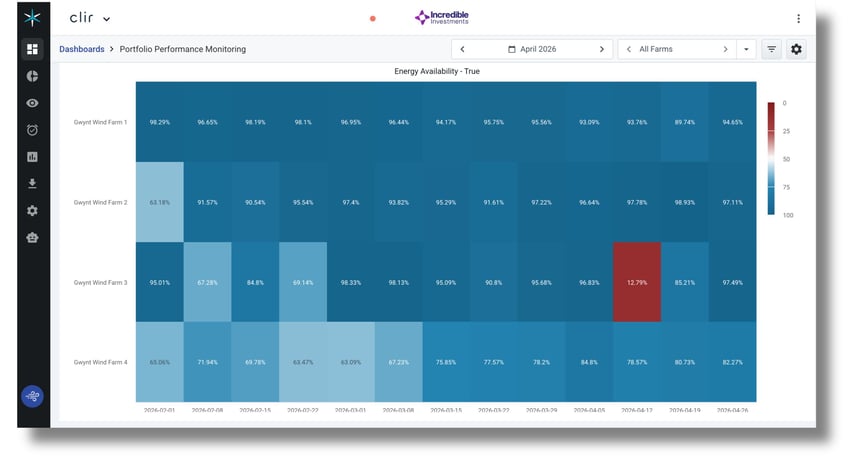
Weekly energy availability across the fleet with indicators telling you where to look first.
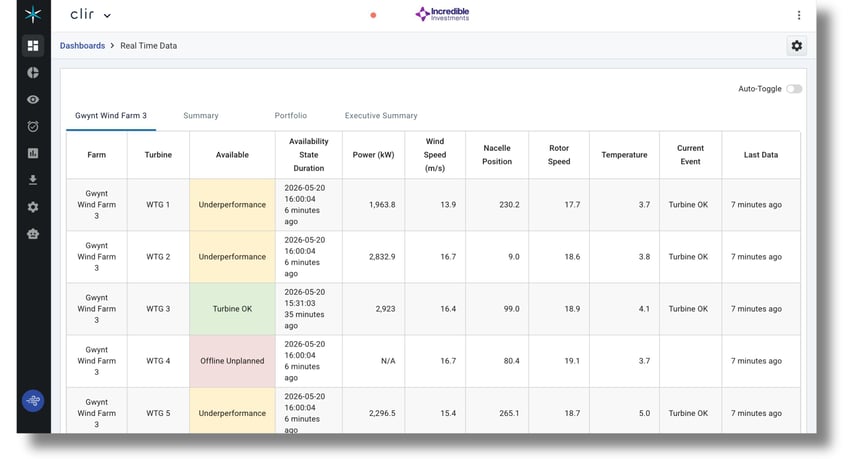
Live turbine status, power and wind speed, refreshed continuously.
Contractual Availability Reconciliation for Wind Farms
Independent availability calculated from source SCADA and event logs, aligned to each contract's definitions rather than the OEM's. AI event detection picks up events the SCADA data misses, and every discrepancy between Clir-calculated and OEM-reported availability is surfaced with dispute-ready evidence.
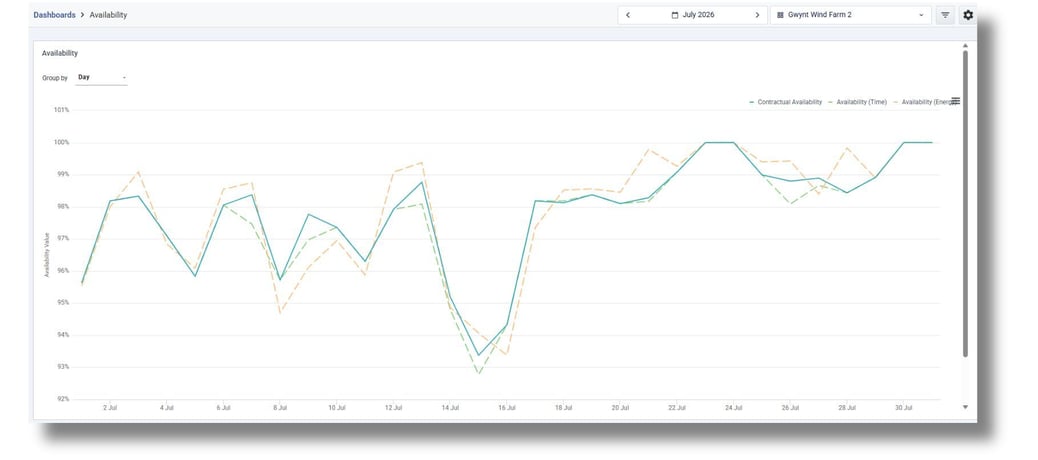
Contractual, time-based and energy-based availability trended day by day, each calculated independently from source SCADA.
Wind Budget Reconciliation and Energy Yield Reforecasting
Actual production reconciled against budget with every deviation categorized: resource, availability, curtailment, downtime and losses by the responsible party. The same standardized history feeds energy yield reforecasts, so budgets, valuations and refinancing models reflect how the assets actually run.
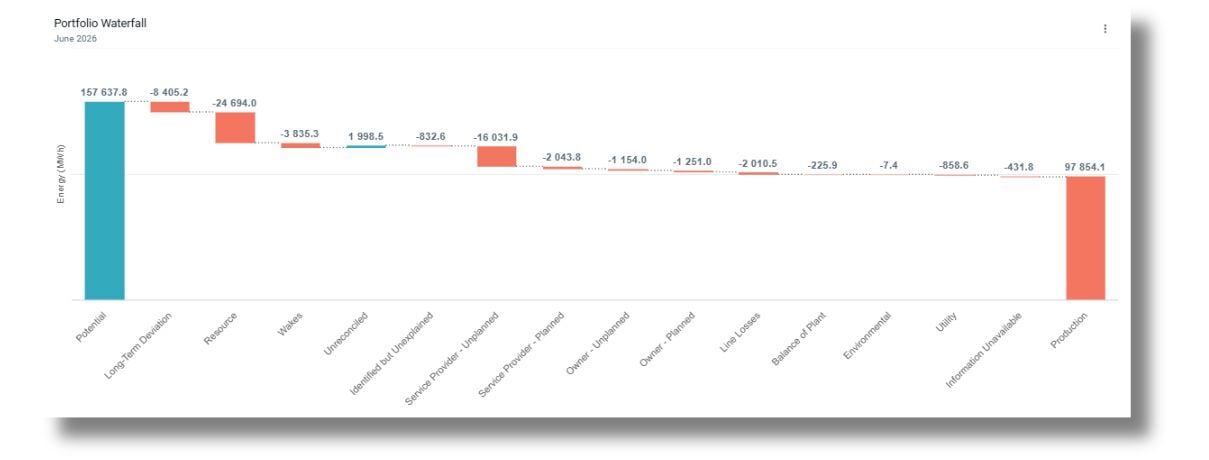
From potential to production, with variance quantified by cause.
Ask Your Own Corporate AI
The Clir MCP connector pipes processed, QA-checked wind data into the AI environment you already run, such as Microsoft Copilot, Claude or another platform, so your team can ask performance and contractual questions in plain language.
One Portfolio View Across Wind, Solar and BESS
Wind, solar and BESS assets onboard into a single portfolio view. For co-located wind-plus-storage or hybrid sites, this eliminates the reporting fragmentation that makes portfolio-level decisions slow and prone to errors.
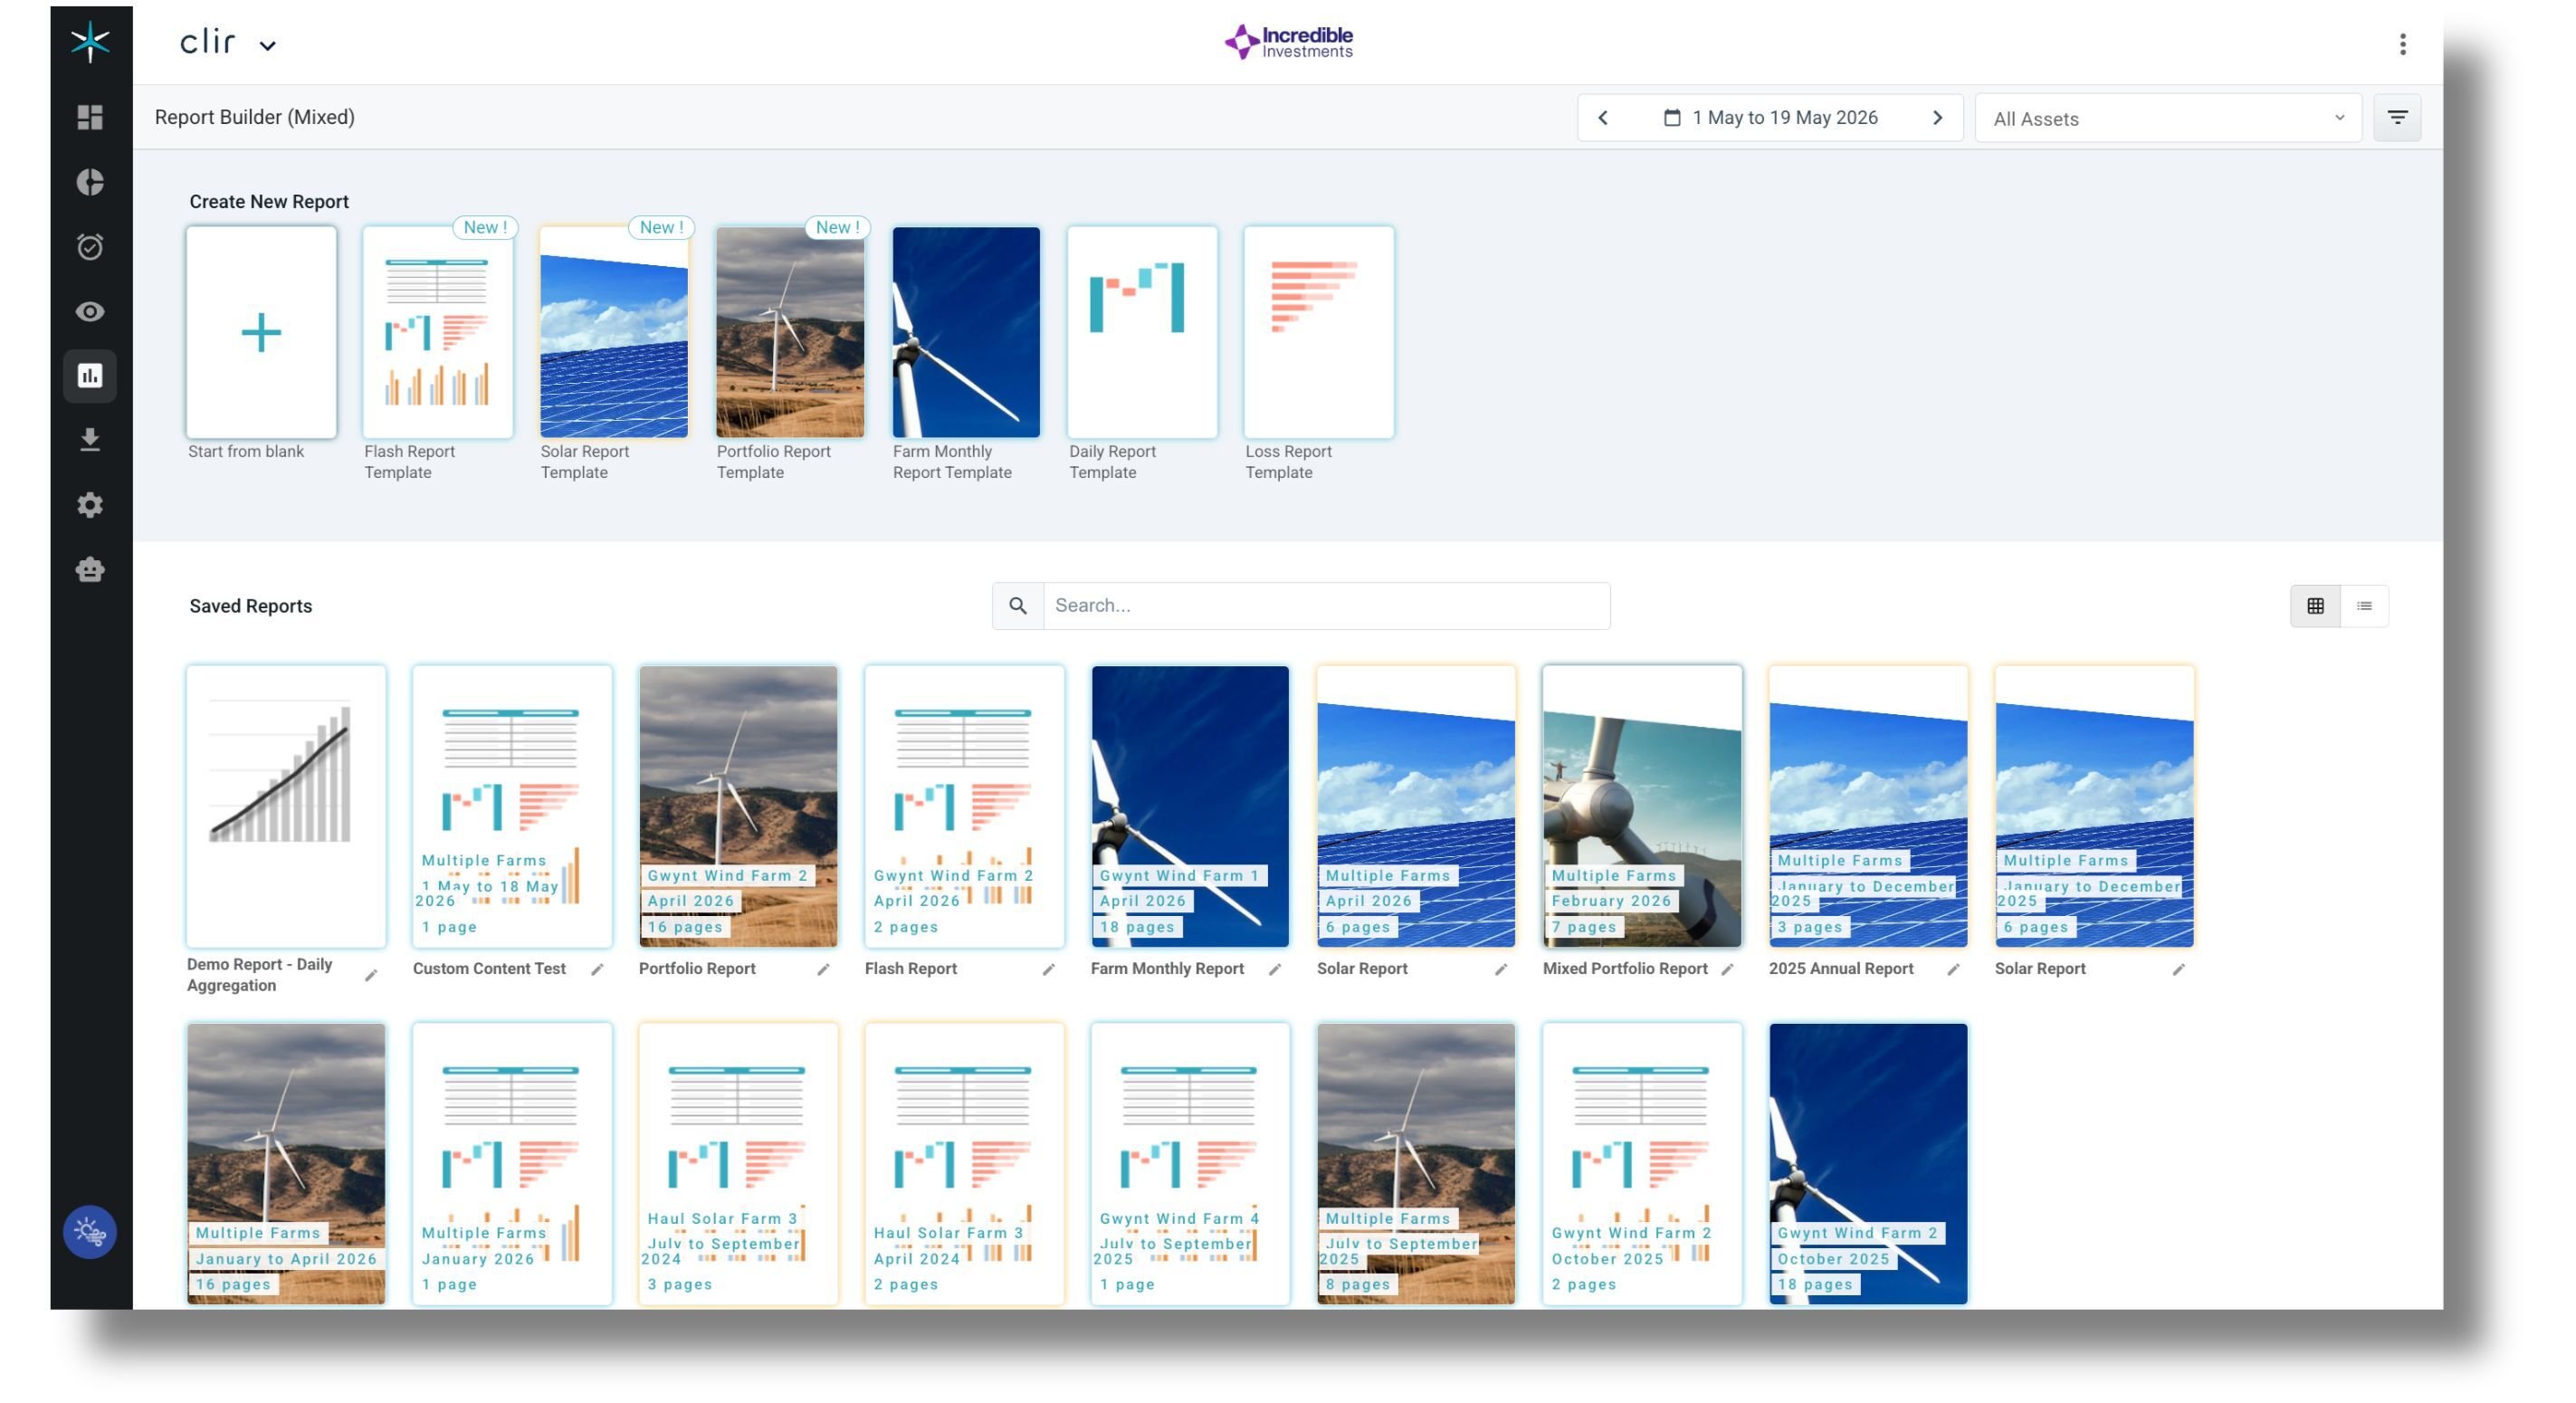
One reporting workflow across wind, solar and storage, from flash reports to annual reviews.

Book a demo
Leverage AI to unlock actionable intelligence for your renewable energy investments.
- Investor Grade Portfolio Reporting
- Contractual Availability Reconciliation
- Portfolio Performance Monitoring
- Budget Reconciliation