At Clir, we’re focused on leveraging large datasets across the project lifecycle to improve operations and production. With global wind farm data on the Clir platform, one way we’re using data is to improve energy yield assessment assumptions.
Traditional wind farm energy yield assessments (EYs) are performed by consultants on a one-off basis. They use generic assumptions on losses or production potential, which is not tailored to the region, technology type or OEM. This means that pre-construction EYs are typically optimistic, with the actual farm performance not meeting expectations. Operational EYs also end up being inaccurate, leading to lower financial valuation.
With industry data from onshore and offshore wind farms across the globe, Clir’s energy yields are based on real-world data, using industry benchmarking data for accurate p-values. We have established benchmarks for farms, technologies and regions, allowing us to use a farm’s peer group for accurate loss factors and predictions of future trends.
This, along with data on how uplifts and upgrades will impact future farm performance, enables robust and defensible EYs for farms.
Energy yield loss factors
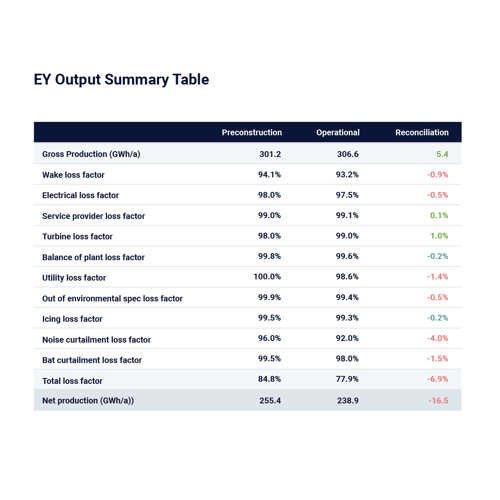
An energy yield loss factor is a metric that quantifies the energy lost at a wind farm due to a specific loss category. Loss categories range from availability loss categories — turbine, grid and balance of plant losses — to icing, derating, performance and more.
Loss factors can dramatically impact the gross production calculations of an EY. Yet, depending on the region or technology, these figures can change significantly. For example, a wind farm in Denmark will experience more icing events than a farm in Texas. When calculating the loss factors of a wind farm in Texas, it would result in inaccurate and likely lower p-values if the icing data from a Denmark wind farm were used. But when consultants use generic numbers across assessments, that is what can happen.
With better quality industry data, owners can leverage data from similar sites for more accurate results. Understanding the regional and technological factors impacting a wind farm enables more reliable estimates of risks and loss factors that will impact production.
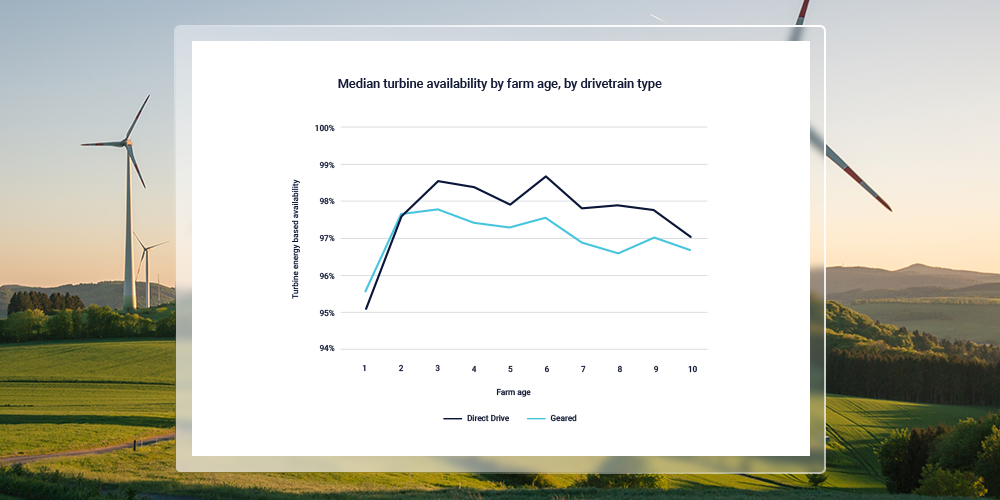
Clir uses peer groups to calculate energy yield loss factors in an equitable manner. For example, a peer group for icing loss factors would consist of farms with similar environmental conditions, but the peer group for turbine availability would consist of farms deploying turbines of the same manufacturer or similar technology. This allows us to use real-world data for our loss factors, making the assumptions more accurate and robust.
Benchmarking grid losses
Consultants leverage a standard assumption for energy yield loss factors, instead of looking at the farm and industry data for accuracy. Instead, our energy yield assessments are based on localized peer trends and configurations that represent the best practice for evaluating the farm’s performance.
For clients, this results in an improved and accurate assessment of performance. For example, one consultant uses a generic assumption of 99.7% for grid availability. Using a larger industry dataset of similar sized farms in that region, we were able to show that the median annual losses for the grid was closer to 99.9%. When clients are looking for financing, these numbers can have a huge difference on the net P50 — an increase of 0.1 to 0.2% can translate into millions of dollars of gains or losses.
Uplifts, upgrades and benchmarking future performance
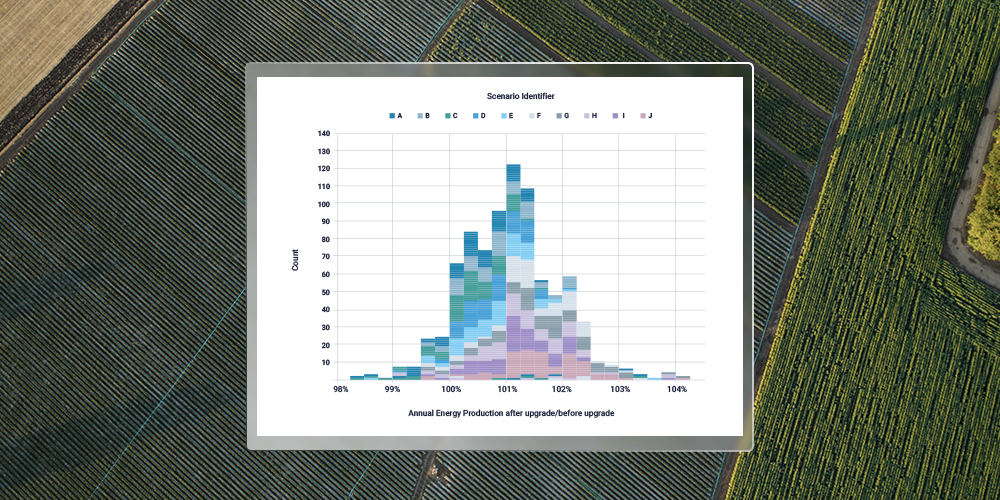
Clir has extensive data on how upgrades can impact the overall performance of projects — from anti-icing technologies to dynamic yaw upgrades. When factored into energy yield assessments, it can help to predict the future performance of a project with those upgrades implemented, leading to higher p-values and providing the financial backing to encourage implementation.
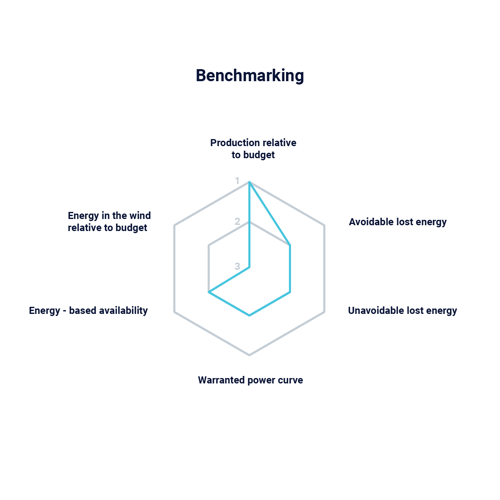
Clir’s peer benchmarks provide context for the performance of the project and to identify opportunities for improvement. With actions available on how to improve performance, clients can ensure that projects are reaching their full potential. As uplifts and optimizations are implemented, Clir’s software will identify and label historical causes of lost energy which have since been resolved or mitigated, allowing more accurate predictions of future losses. Independent engineers can leverage this data to more robustly predict future farm performance and p-values.
When entering into a sales process, understanding what optimizations have been implemented can help buyers understand the performance and health of the asset. It can also help potential buyers understand the impact of future optimizations, if they choose to implement them. This helps to capture the true value of the project.
Case study
Implementing upgrades to improve project valuation
To showcase how uplifts and upgrades can influence wind energy p-values, it is easiest to look at a client journey. A client had been leveraging Clir on its offshore wind farm to understand and implement performance improvements based on the region and technology type. Over the years, multiple upgrades had been implemented and, using our benchmarking data, the client was able to understand if the parameters of the upgrade were correct.
For one optimization, the upgrade validation analysis showed that the farm was not experiencing the same improvements to performance that peer farms had seen. Using the farm data alongside benchmarking data, the owner was able to work with the OEM to get the right parameters for the upgrade, ensuring the farm was seeing optimal performance improvements.
When the client enter the sales process, it wanted to ensure that the work they had done to improve performance was used to increase the project's valuation. Using the farm’s historical data, alongside data from other farms that implemented the same upgrades, the client was able to show the positive impact the upgrade would have over time. Working with the consultant on the buyer’s side, the upgrades were leveraged for improved EYs.
Improving project valuations
With large industry data sets, peer groups can provide robust insights into losses and upgrades, improving energy yield assessments, instead of leveraging generic assumptions that inaccurately represent performance. With enriched historical and benchmarking data, and a validated methodology, Clir’s P90/P50 ratio is higher than consultants as our methods ensure uncertainty is lower.
For clients, these robust and higher wind energy p-values have enabled improved financial valuations. This can contribute to improved debt terms, acquisition decisions and financial models. This can help to increase investment and confidence in the industry, accelerating the renewable energy transition.