
Is more data always better?
As renewable energy investments increase, new innovations to optimize performance, mitigate risks and improve returns are becoming available. Learning how to use these technologies together can help you maximize portfolio performance and efficiently identify risks.
High-frequency SCADA
Standard practice in the wind energy industry is to analyze performance issues using 10-minute SCADA data. Historically, the choice of a 10-minute sampling frequency was driven by data storage costs. However, today, 10-minute data still remains the industry-standard for wind turbine SCADA data.
Occasionally, stakeholders want to leverage higher frequency data for turbine performance analytics, typically using data sampled between 1 Hz and 10 Hz. The motivation for using this high-frequency data is that it can provide visibility into turbine dynamics occurring at higher frequencies, which 10-minute data cannot. High-frequency data allows users to have greater visibility into the dynamics of components and systems which vibrate or rotate at higher frequencies.
Unfortunately, with more data comes more challenges: it can be time-consuming to ingest, standardize and analyze high-frequency data, with varying results. However, there are occasions when this data can be beneficial to owners and asset managers, especially when used in conjunction with industry standard 10-minute data.
Is more data better?
There are a few reasons why we recommend that clients seek to maximally exploit their 10-minute data streams before considering high-frequency analysis:
-
Industry-standard for wind turbine SCADA systems is to record 10-minute data. That means that to gain access to high-frequency data, owners typically need to install hardware or renegotiate contracts with their OEMs.
-
With an abundance of data points, data wrangling and management are extremely onerous for high-frequency analysis. Consider that one month of 1-second data is equal to 50 years of 10-minute data. Cleaning and standardizing these large quantities of data can be time-consuming. Analytics can be challenging due to changing rotor speeds. It also must be undertaken on a per-turbine basis, which can be demanding.
-
Fewer stakeholders collect and store high-frequency data, which means that it isn’t deployed at scale. This limits the ability to develop performance and risk benchmarks for the industry using high-frequency derived analytics, as there is less data available. Benchmarking is becoming critical as the industry grows and investors look to maximize the financial performance of assets.
Using high-frequency data for targeted assessments
Leveraging industry benchmarking data alongside high-frequency data can help owners hone in and diagnose issues without having to manage huge quantities of data.
Clir’s 200 GW of industry data enables owners to understand big-picture issues that may be impacting their farm based on issues that have been identified in the peer group. Owners can analyze performance and risk issues based on location, turbine technology, OEM and O&M. It also enables an understanding of loss factors, availability, and budget deviations, while delivering actionable strategies to maximize performance and minimize risks.
By leveraging available 10-minute data and benchmarking data, owners will be able to efficiently identify big-picture issues or causes of underperformance. Owners can then dig deeper into the identified issues using the high-frequency data, when necessary. Industry benchmarking data enables efficient identification of issues on specific turbines and projects, while high-frequency data can be used for deeper analysis helps to find the root cause, answer questions about ‘why’ and enable efficient analysis. When used together, it will help reduce the issues that come from managing large quantities of data across entire farms or portfolios.
Other opportunities for high-frequency data
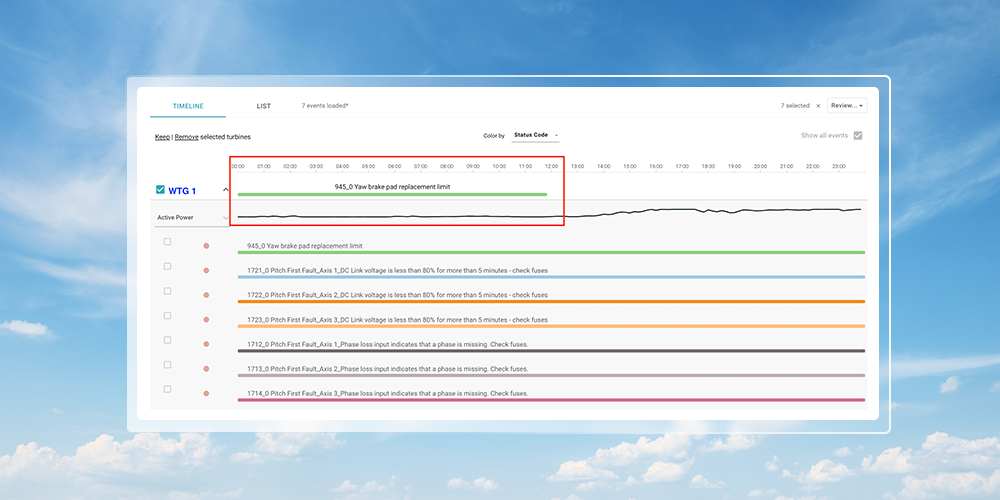
- Mitigate risks: By uncovering known and common issues based on your technology, owners can use market insights to guide where high-frequency analysis should be deployed, based on the risks. This can help to mitigate issues and guide repair and replacement strategies before it results in catastrophic failures. For example, if your blades experience higher than average failure rates, it would be beneficial to start using high-frequency data to monitor them prior to significant issues.
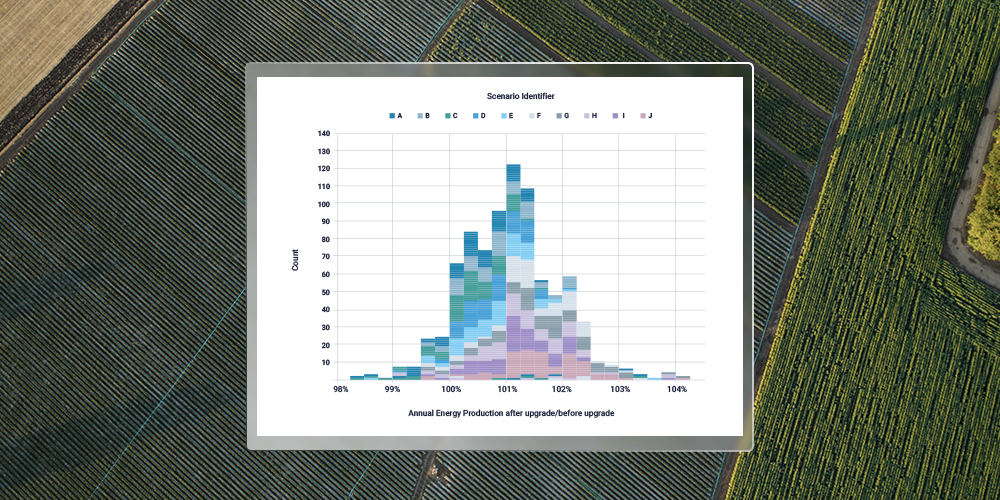
- Static yaw misalignment: Identifying static yaw misalignment is one area where high-frequency data excels. This problem is invisible to the turbine controller, but using data can enable a constant analysis of the status of the yaw misalignment.
- Rotor imbalance: High-frequency data also enables identification and monitoring of rotor blade imbalance, including aerodynamic and mass imbalance.
Leveraging Clir’s benchmarking data
With the largest wind and solar dataset, we can help owners to find macro level problems that may be impacting their portfolio based on issues found on comparable farms across the globe. This enables proactive identification and optimization of common, controllable losses. When used in conjunction with high-frequency data, owners can have greater transparency into issues impacting their portfolio.
Interested in learning more about high-frequency data? Have a CleanTech or data question that you’re looking to understand? Contact us today.