Renewable energy investors are facing many challenges. As government subsidies dry up and profit margins become tighter, a greater focus is being placed on technology reliability and farm availability.
This means that owners and operators are seeking to understand the reasons for smaller under performances and deviations in turbine availability. To improve higher turbine performance and reduce downtime, owners need failure prediction, performance optimizations, turbine upgrades and other data driven solutions.
From an industry benchmarking perspective, how well do we understand technology performance and reliability? How much does your choice of OEM or turbine model steer your farm's availability? How does this affect profits?
With over 200 GW of industry data, Clir can investigate common turbine availability issues impacting farms across the globe. This large-scale dataset can allow owners to understand, predict and mitigate common issues before they occur.
Industry availability
General turbine availability trends indicate that in the first year of operations, there is poor availability. This is typically due to commissioning issues and high rate of component failures in early life from design or manufacturing defects.
These “teething issues” improve after year one, but median availability across the industry dataset follows a decreasing trend past year four. This can be expected due to turbine components reaching the end of warranty, along with degrading due to wear and tear from normal operation.
OEM availability
Splitting turbine availability by OEM indicates that some OEMs achieve higher availability in general. One OEM’s turbines (OEM 3) are noted to achieve a relatively low availability compared to other major OEMs. OEM 3 performs poorly in early years of operation, before the median availability improves.
Various factors could be considered to explain the variation in availability between OEMs. This includes drivetrain type, geography (IEC class, practices, and accessibility), and supply chain.
In choosing turbines for your wind farm, it is important to consider the availability and investment strategy. For example, are you a developer planning to sell your asset shortly after COD? Choosing an OEM with fewer teething issues and better availability early in the project lifecycle can impact M&A transactions that take place early in the project lifespan.
Drivetrain availability
Direct drive turbines advertise greater availability than geared turbines, but what does our data show? Insights from our global dataset can help owners understand availability and risks based on the drivetrain they have selected.
Our dataset shows that this is true, excluding the first year of operation. After the first year of operations, direct drive median turbine availability outperforms geared by around 1% for most years.
Both experience a decrease in availability as years progress, at a similar rate.
However, looking at the distribution of availability behind the median values indicates that it is in fact possible to achieve higher availability with geared machines compared to direct drive machines across all farm ages.
This begs the question: despite direct drive machines achieving better overall availability, with very proactive and thorough maintenance, can cheaper geared machines perform as well as their more expensive direct drive counterparts?
At Clir, we believe the evidence suggests that it is already possible for geared turbines to achieve higher availability than direct drive machines. It’s a matter of ensuring the right operations and maintenance strategies are in place to increase availability for geared turbines.
When considering operating costs alone, direct drive turbines may indicate the better choice. High reliability and lower operating costs have been the primary selling points of direct drive technology, which research and data support.
Component risks
Using our enriched operations and insurance claims data, we’re able to identify the top component risks across OEM and turbine types. One way of doing this is by calculating the ratio of insurance claims cost per component category from the total claims costs.
The below graph shows this claims cost per component ratio, also split out by OEM, and therefore, which components are of higher risk for each of the major OEM’s analyzed.
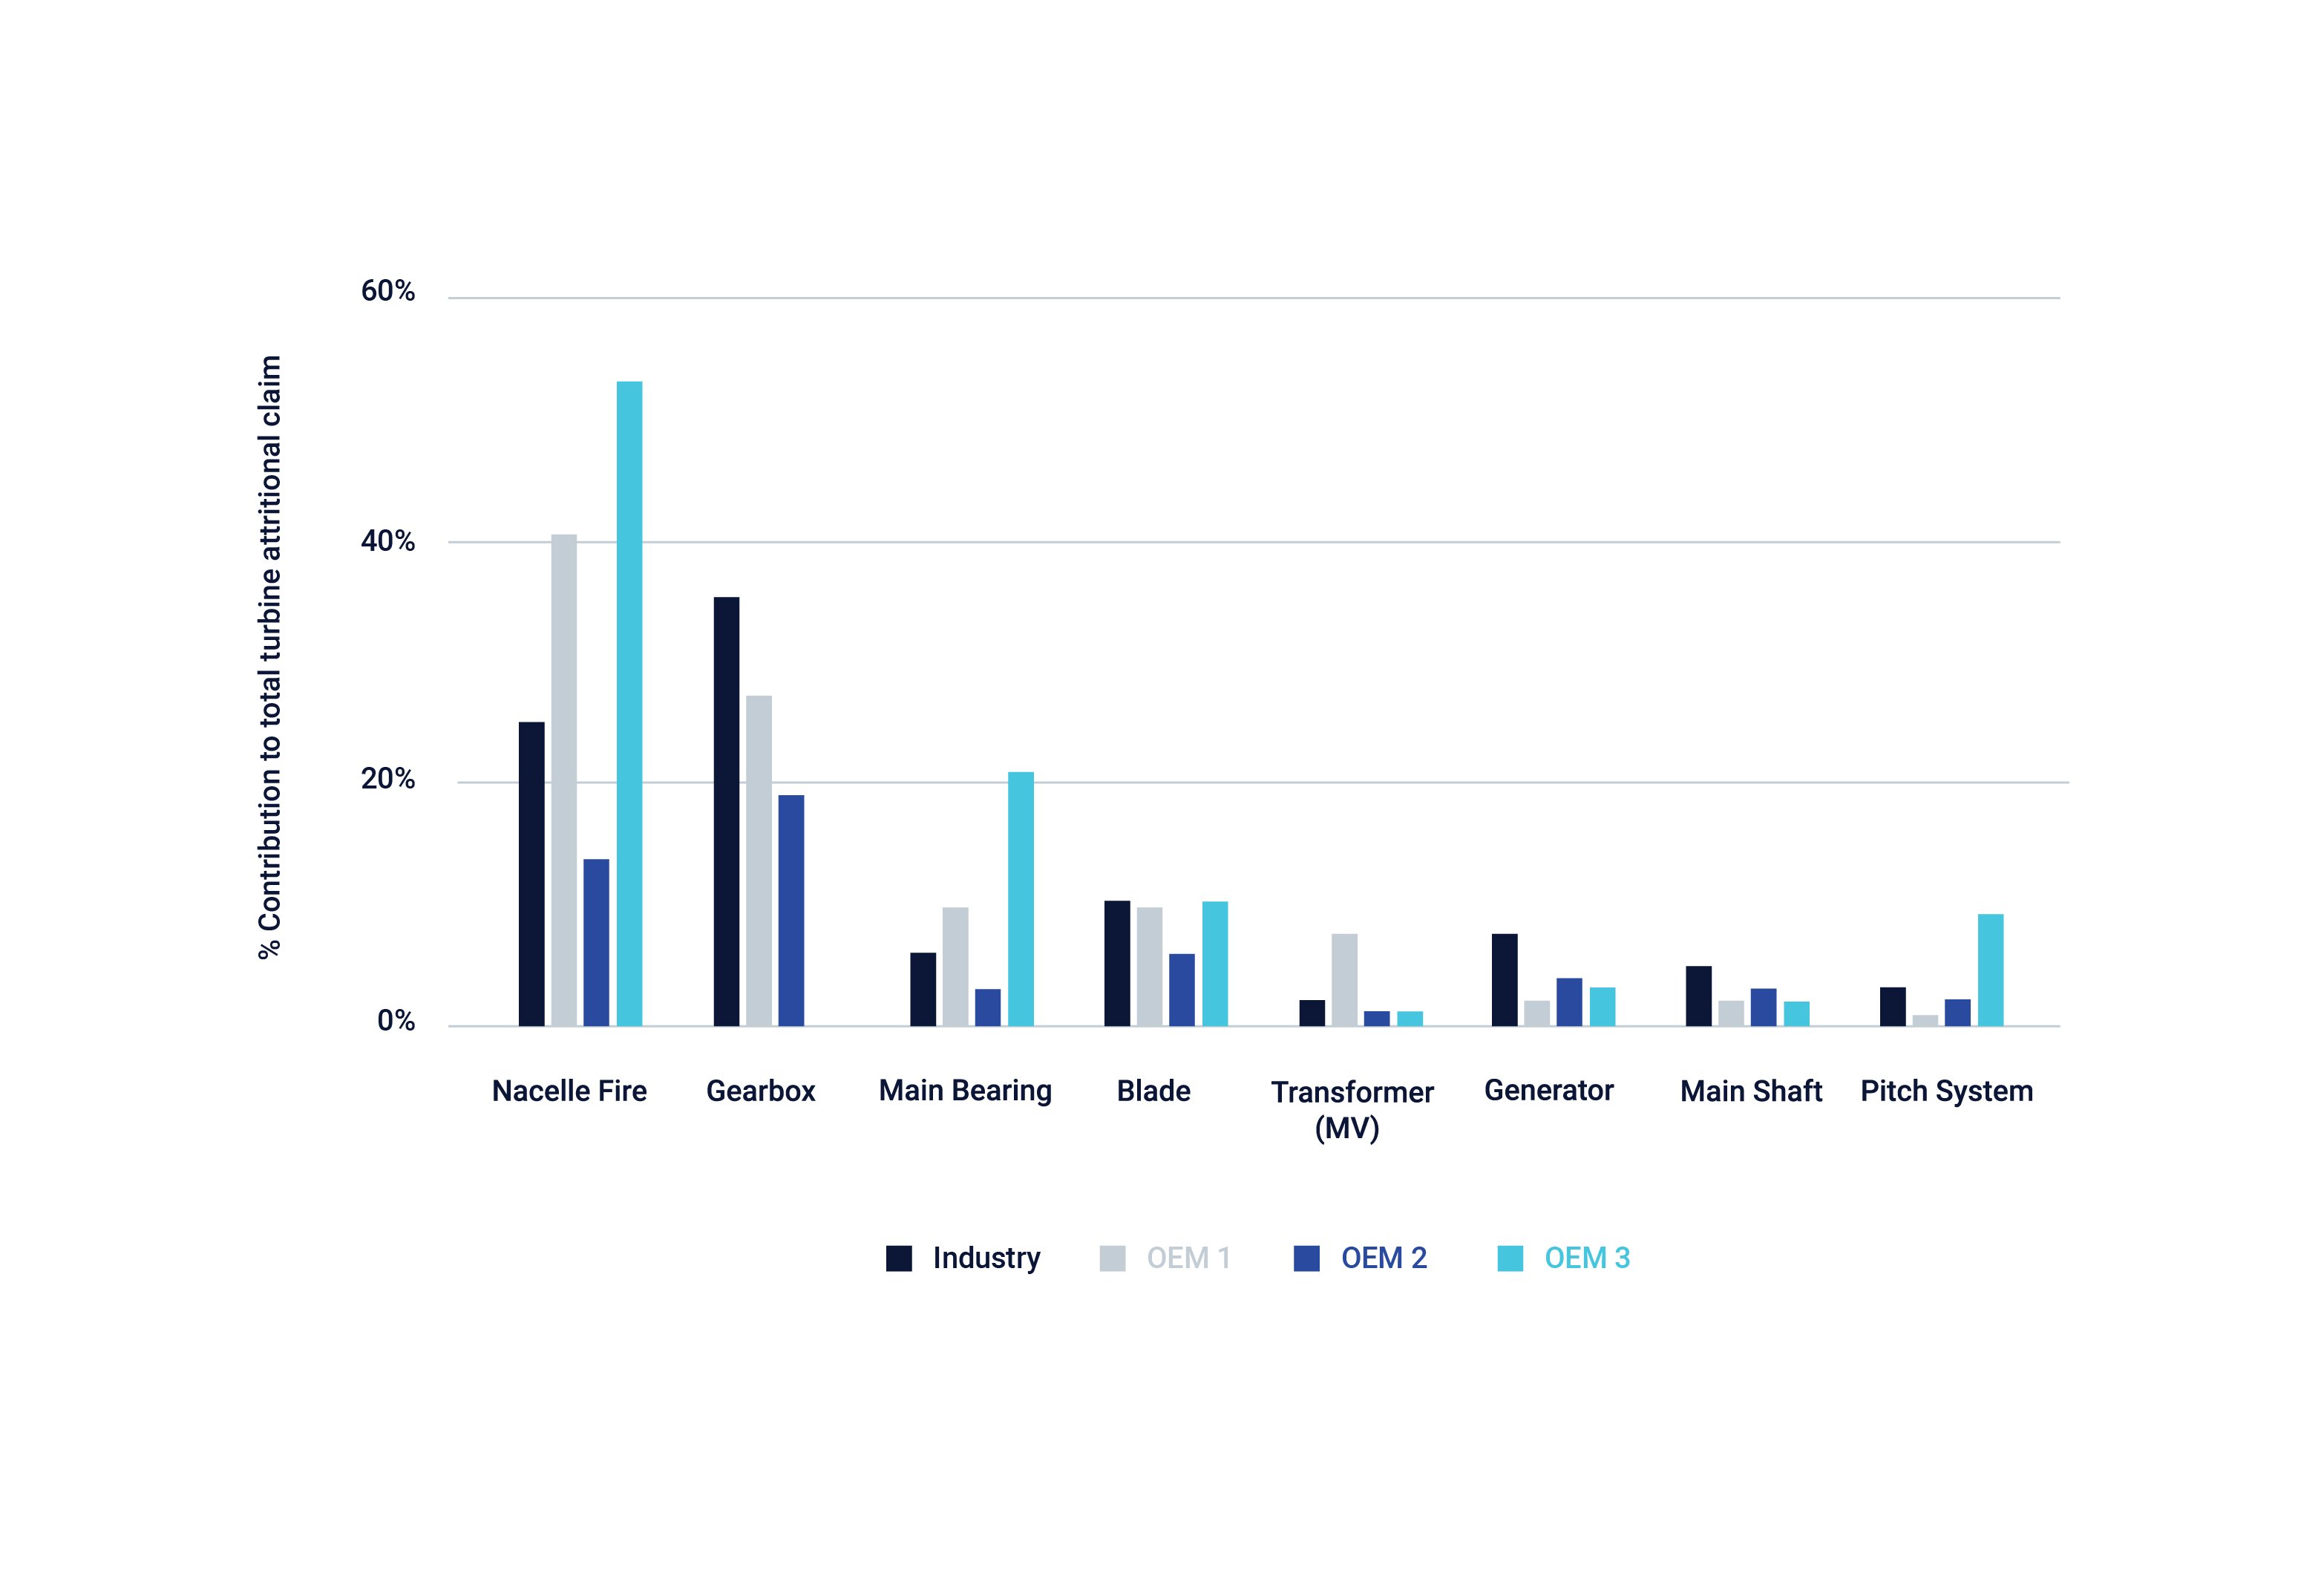 This data shows that the biggest risks across the industry are nacelle fire issues and gearbox failures.
For each component group, risk varies significantly between OEM. For example, OEM 3 is direct drive turbines, which means that naturally there are no gearbox risks. However, it does have the highest risk for nacelle fire, main bearing, and pitch system claims out of the three major OEMs analyzed, and significantly higher risk than industry average for the same component categories. Despite the fact that using direct drive turbines reduces gearbox-related risks and associated costs, it does not always mean that component risks costs will be lower.
Employing data for improved profitability
Using different availability profiles from this analysis, we can understand the commercial performance of each option. This can help owners make data-driven pre-construction and M&A decisions, as they can answer key questions:
- How can owners ensure they pick the right technology?
- How can I know if my contractual availability target is causing me to miss out on realistically achievable revenue?
Should I invest in extended warranties for my turbine components?
By making the right turbine technology decisions, clients can achieve improved financial performance across the entire project lifecycle.