Energy yield assessments have a direct impact on the financial valuation of a farm, making them vital for asset sales, project refinancing and insurance. Energy yield metrics are used to help validate production and risk, yet these assessments are usually rushed and only completed when necessary. By doing this work on an ongoing basis with quality datasets, better outcomes and higher project valuations are achieved.
Ongoing optimization efforts represent an opportunity to concretely improve energy yields, which can then improve bids or reduce insurance costs.
Optimization for improved net P50
The net P50 is a forecast of the average annual energy production of a wind farm. It’s based on the total site capacity and is a critical figure for financing projects.
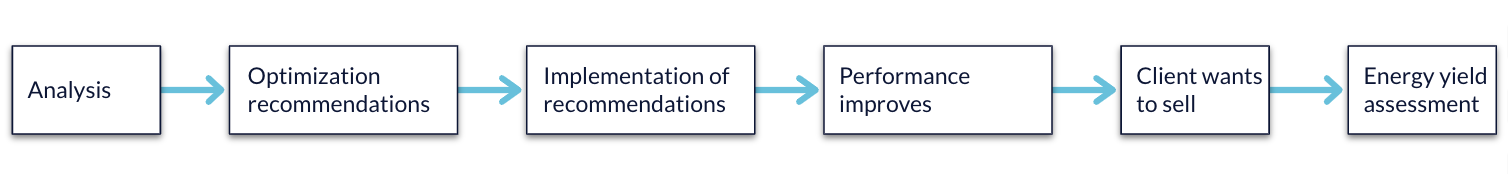
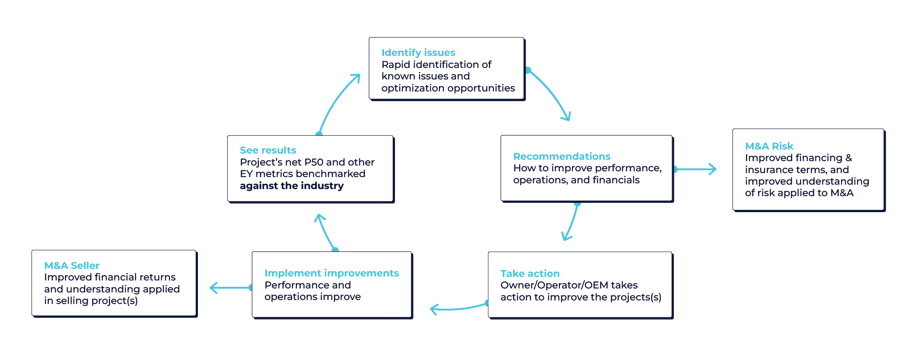
In a typical process, the optimization recommendations to improve asset performance are given well before the client decides to sell the asset. Although performance improves, it’s hard to quantify the impact of the changes directly in terms of energy yield metrics (net P50, loss factors, P90 to P50 ratio, etc.) or to ensure optimal performance is taken into consideration for the energy yield assessment.
By regularly tracking the energy yield metrics, benchmarking them against comparable farms and evaluating progress over time, the net P50 can be increased in a more defensible and transparent way. There are tangible actions that owners can take to improve the net P50 throughout the lifecycle of the project that will improve a farm’s valuation and financial model.
A proactive approach to continually monitoring the farm’s net P50 allows clients to constantly optimize their assets and review the effect on their energy yield and financial valuation. When the client is ready to sell, this allows them to quickly start the M&A process with the best energy yield, project performance and farm valuation. This can ensure that the client is choosing the opportune time to sell an asset to get the highest return.
Clir’s energy yield assessments
With the idea of integrating energy yields throughout the project lifecycle, Clir set out to track and benchmark the net P50 changes over time.
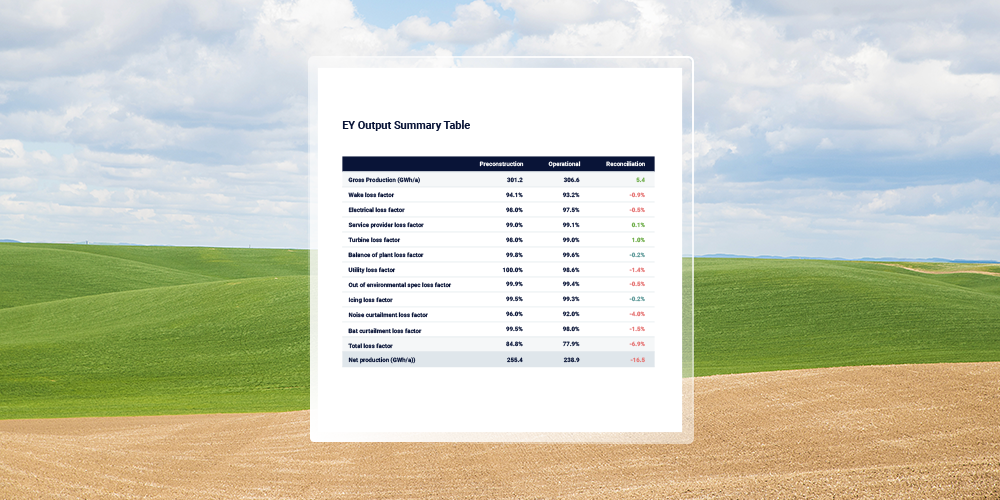
Clir developed an industry-leading methodology to produce wind farm operational energy yield assessments. It leverages Clir’s data model, which standardizes, accurately labels and enhances portfolio data for improved data quality. It also leverages Clir’s Energy Yield (EY) Engine software, which is used to forecast the long-term production of every wind farm on Clir Portfolio. The EY Engine uses automated data organization, categorization and enrichment, alongside manual oversight by an expert analyst, to ensure the results are fully robust and to reduce uncertainty.
After a farm is onboarded onto Clir and the data is enriched, an analyst reviews all available information and defines an EY configuration that represents how a best practice EY is carried out at the farm. An EY configuration can be thought of as the AI that powers our EY engine. The AI uses the EY configurations stored in Clir’s database to produce EY results based on the latest operational and meteorological data.
Clir’s wind analysts have created EY configurations for over 100 farms on our system. For each farm with a saved EY configuration, up-to-date EY results can be viewed on-demand. These EY results are also added to our system, allowing us to benchmark them against each other, and compare assets by technology and region.
What can we learn from this? Looking at the net P50 distribution of the farms allows us to see where each one falls for long-term predicted capacity factor. Clients can compare how their farm is performing compared to their peers and, if it’s performing poorly, understand and rectify the loss factors that are impacting their score.
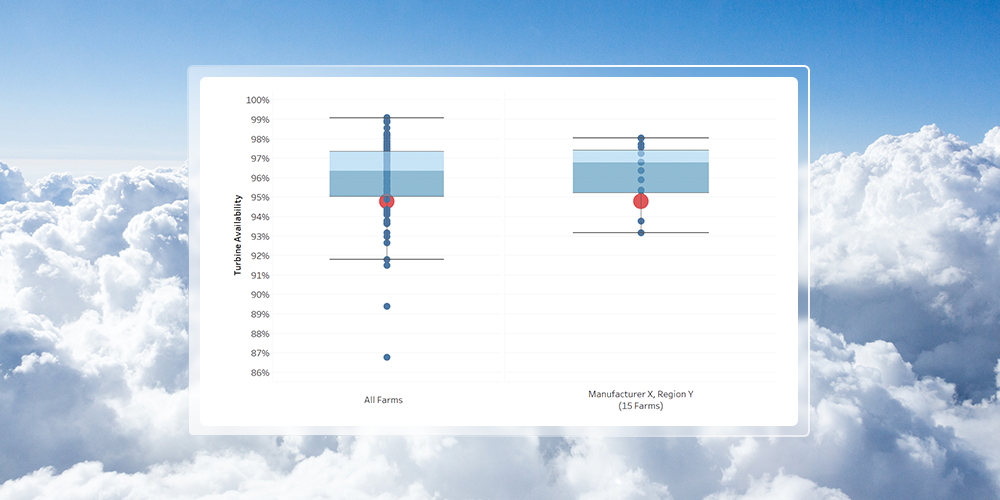
The example below is showing the projected future turbine availability loss factor directly used in an energy yield for a specific farm of interest.
- Farm value = 94.8% (red)
- Full data set median = 96.3%
- Peer group median = 96.8%
- Peer group P25 = 95.2
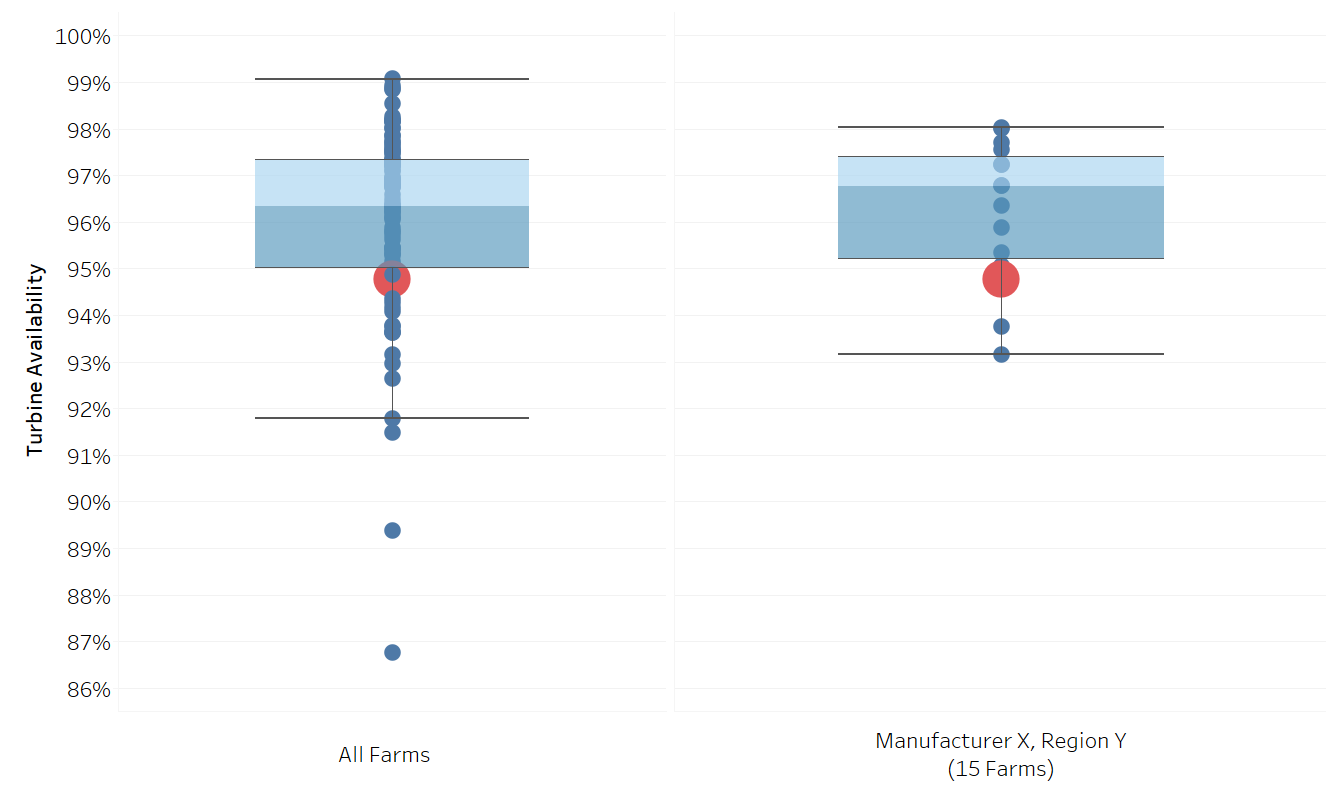
In this case, the projected future turbine availability is two per cent below the peer group's median and below the peer group P25. This could be an argument for better service from their provider. Discussions with turbine service providers can be challenging, particularly when the wind farm owner suspects the turbines are underperforming. Clir uses benchmarking, results from optimization analytics and our broad industry knowledge base to build a case with the service provider that improvements are possible and intervention is required.
Continuing with the example above, the project’s future net P50 can be modelled for hypothetical loss factor scenarios from Clir’s EY benchmarks, as shown in the table below. In this case, if project availability reverts to the median turbine availability of the peer group, then the net P50 will increase from 90.1 GWh/a to 92.0 GWh/a, resulting in better financial performance and higher project valuation.
| Modeled net P50 (GWh/a) using peer group turbine availability | |||
| Project net P50 (GWh/a) | P25 | P50 (median) | P75 |
| 90.1 | 90.4 | 92.0 | 92.5 |
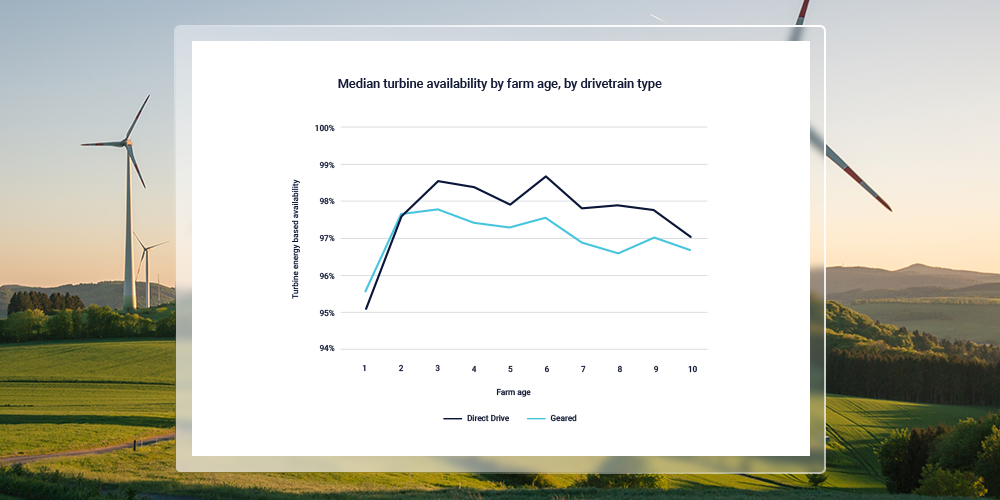
Comparing farms to similar regions or technologies also allows us to understand how components interact in different environments. In the pre-construction and development phases, owners can use these figures to make data-driven decisions about the best technology for their project’s region. For example, if onshore projects in Europe have a higher net capacity factor with a specific OEM, owners may want to use that OEM on similar projects for improved performance and financing.
Increasing your net P50
Energy yield assessments capture two elements of production:
- How much wind energy is available to be captured at the site (wind resource), and
- How much energy will be lost, bucketed into loss categories.
By analyzing the net P50 and energy yields, clients can understand their farm’s top loss categories and, where possible, optimize to reduce losses. Loss categories that can be improved include:
- Grid curtailment.
- Component failures or defects.
- Performance degradation.
- Control anomalies.
- Derating and downtime.
- Icing.
By leveraging Clir Portfolio, owners can actively and continuously improve their net P50 by:
- Reducing losses.
- Implementing the actions from Clir’s actions page.
- Implementing upgrades.
- Increasing grid export capacity.
- Flagging events that are anomalous and are not expected to recur at the same frequency, thereby increasing future predicted availability.
From there, the net P50 can be tracked on a regular basis and will change depending on farm performance. This allows the owner to actively work towards maximizing performance for a higher valuation, allowing for an improved sales process, better financing or reduced insurance costs.