Enriched data to accelerate value and improve transparency
By ingesting, standardizing and enhancing millions of data points, Clir accelerates the speed of analysis, improves analytics and enables data transparency for efficient, industry-leading outcomes.


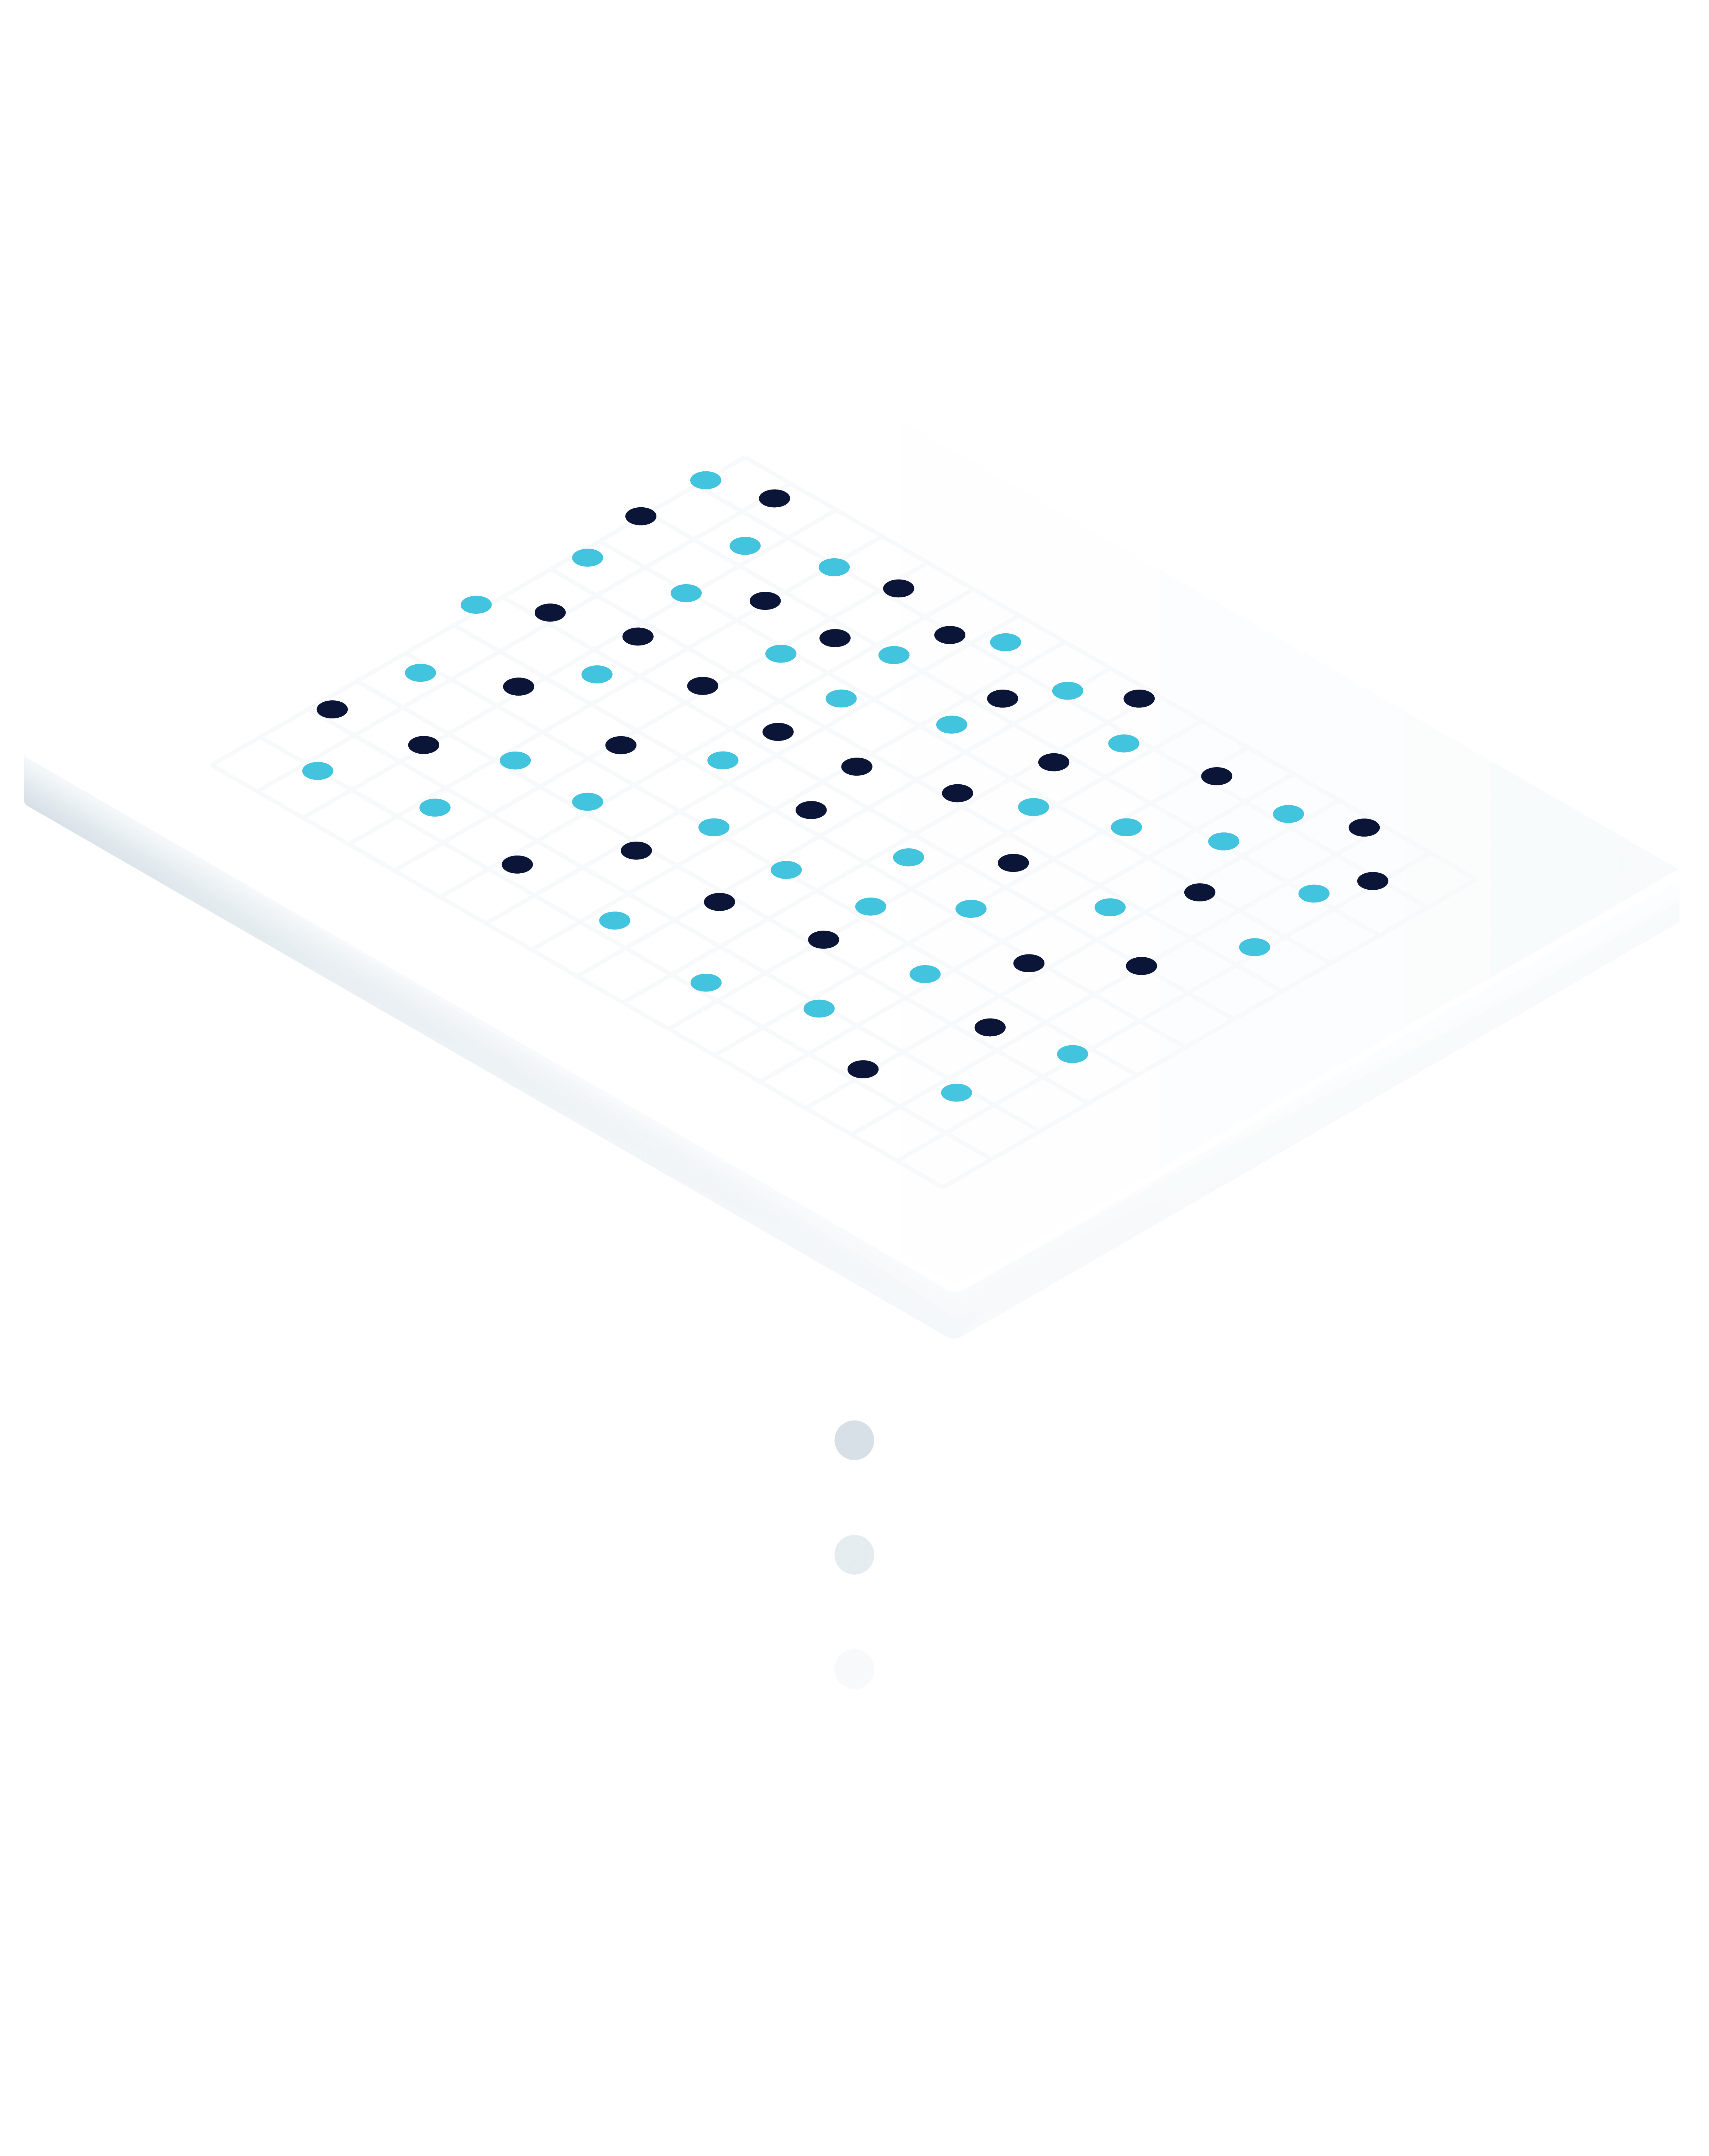
1. Raw SCADA data
Clir leverages millions of data points — including SCADA data, project metadata, and operations and sensor data — to provide a holistic view of asset performance, health and risk.
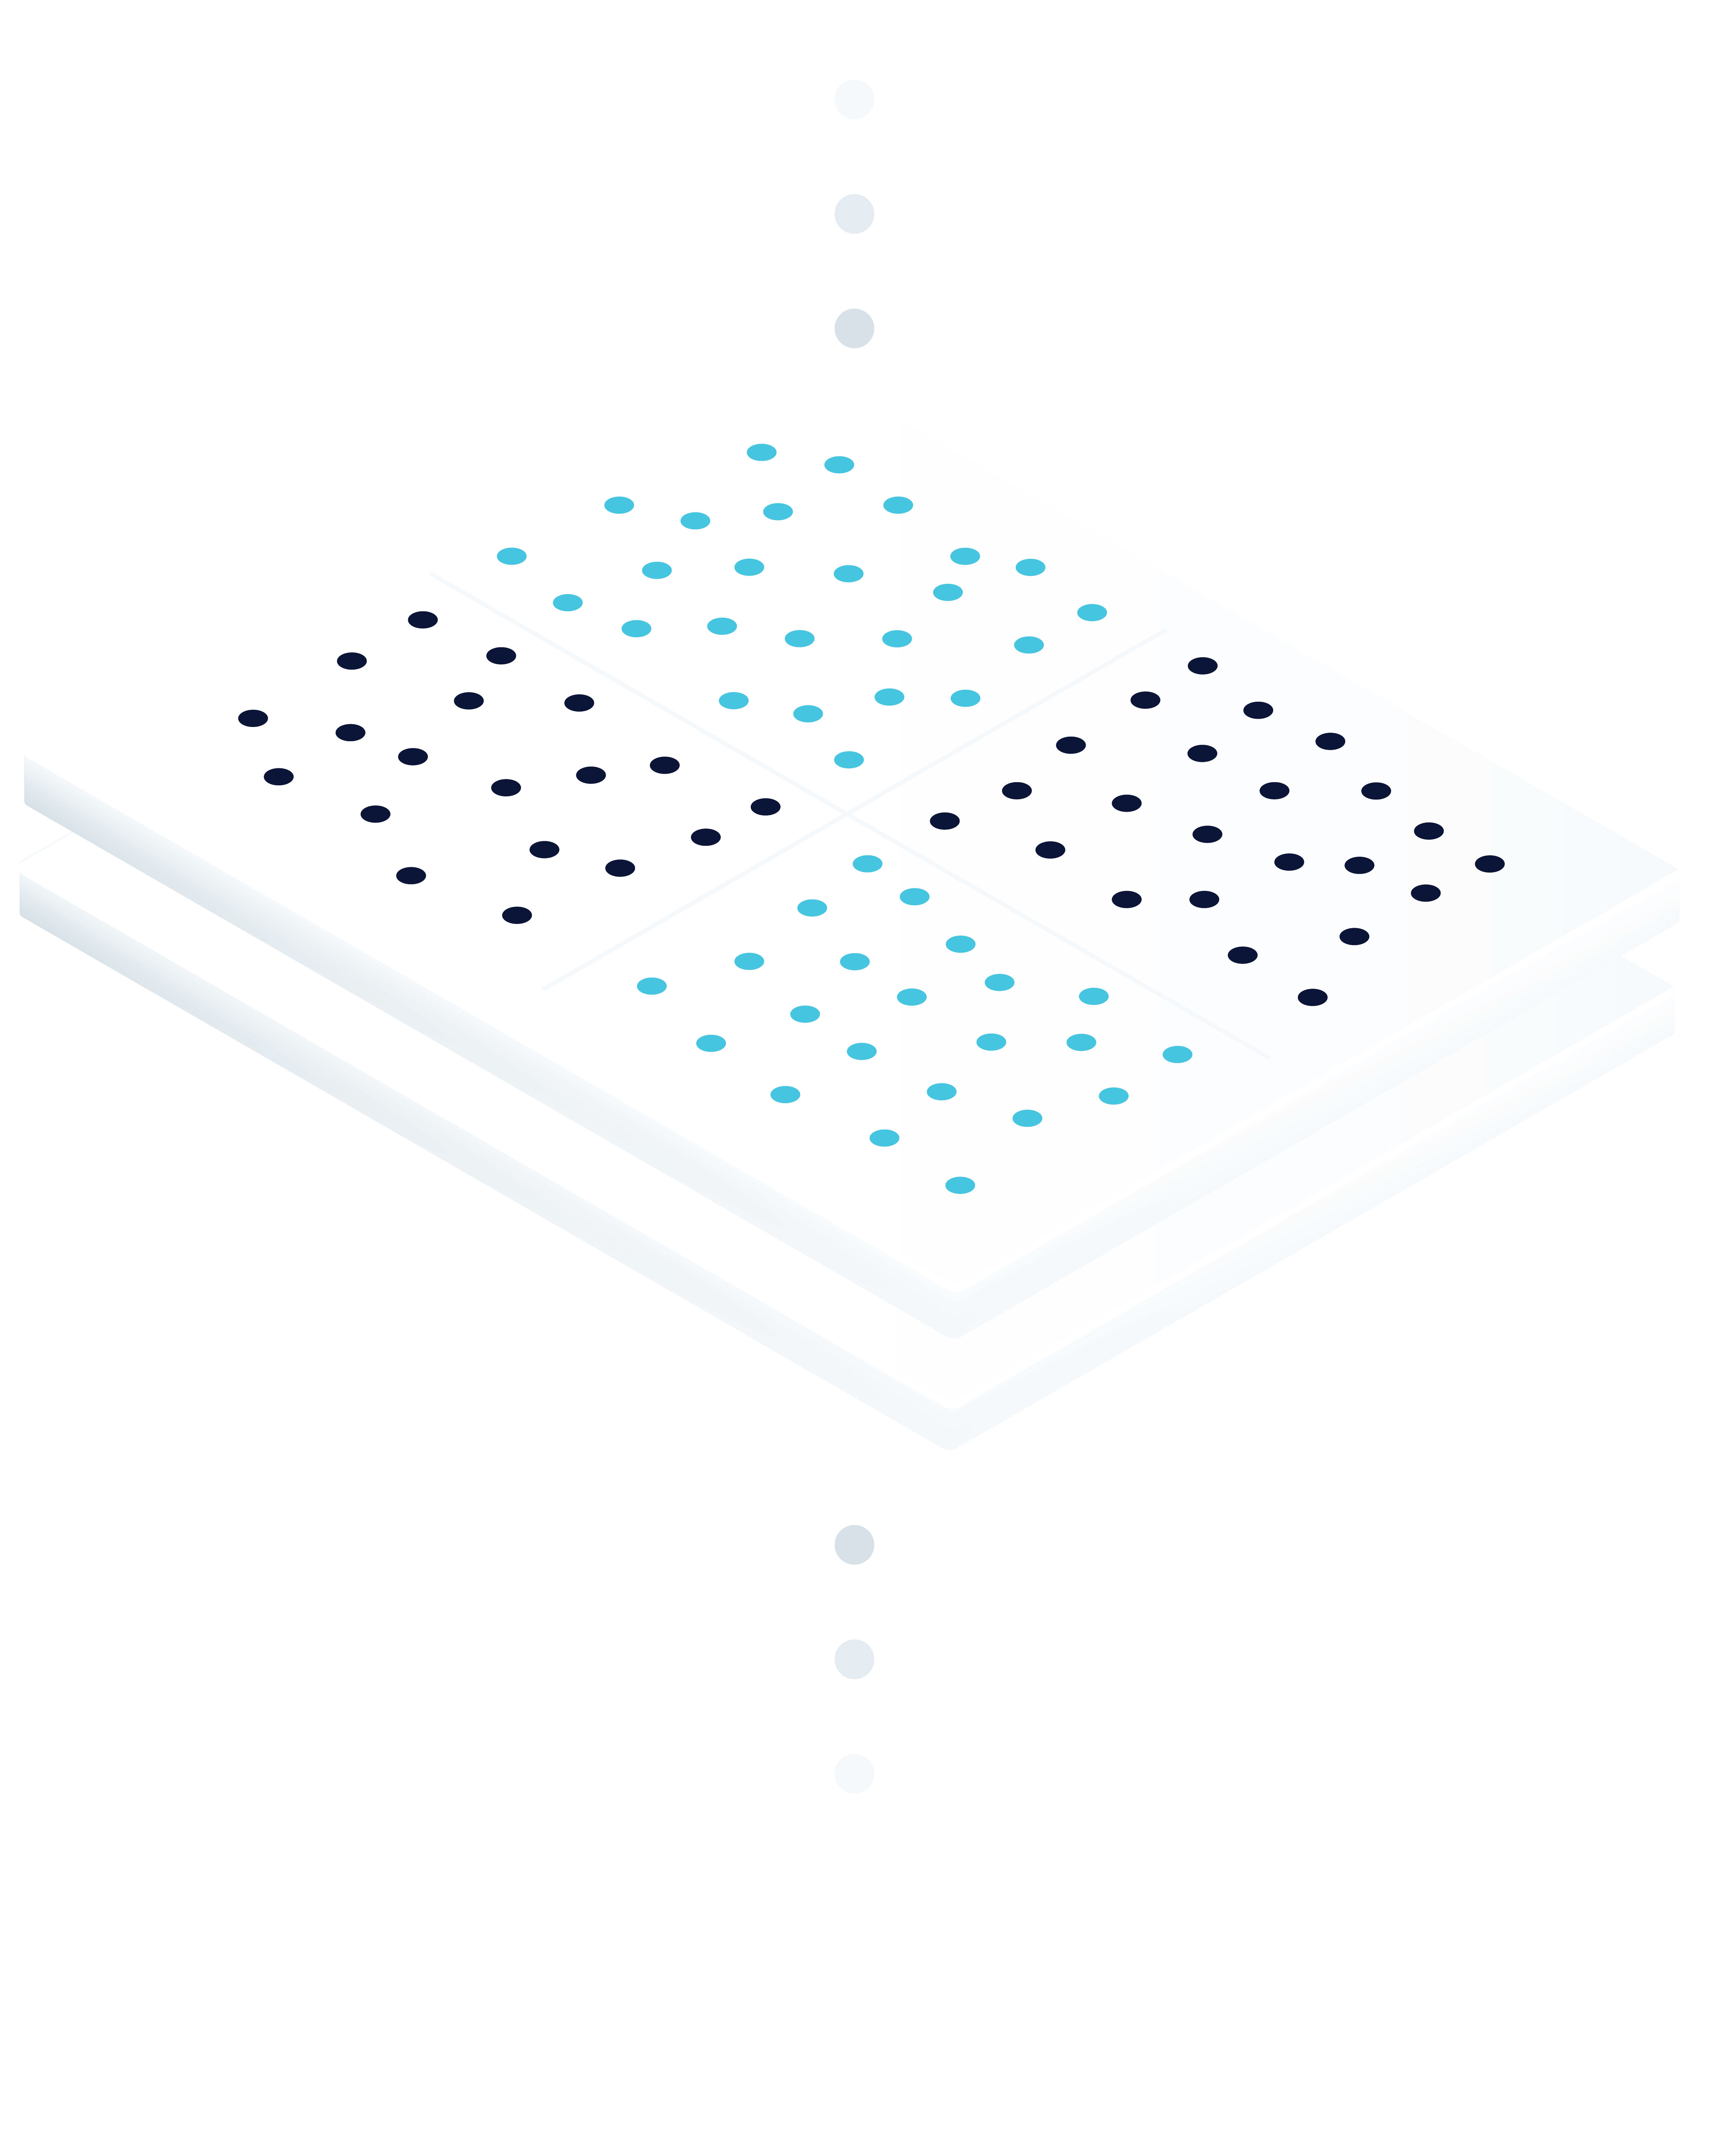
2. Ingest and standardize
Machine learning algorithms and programmatic labelling transform the disparate data into a clearly defined standard, allowing deeper insights into KPIs and accelerated time to analysis.
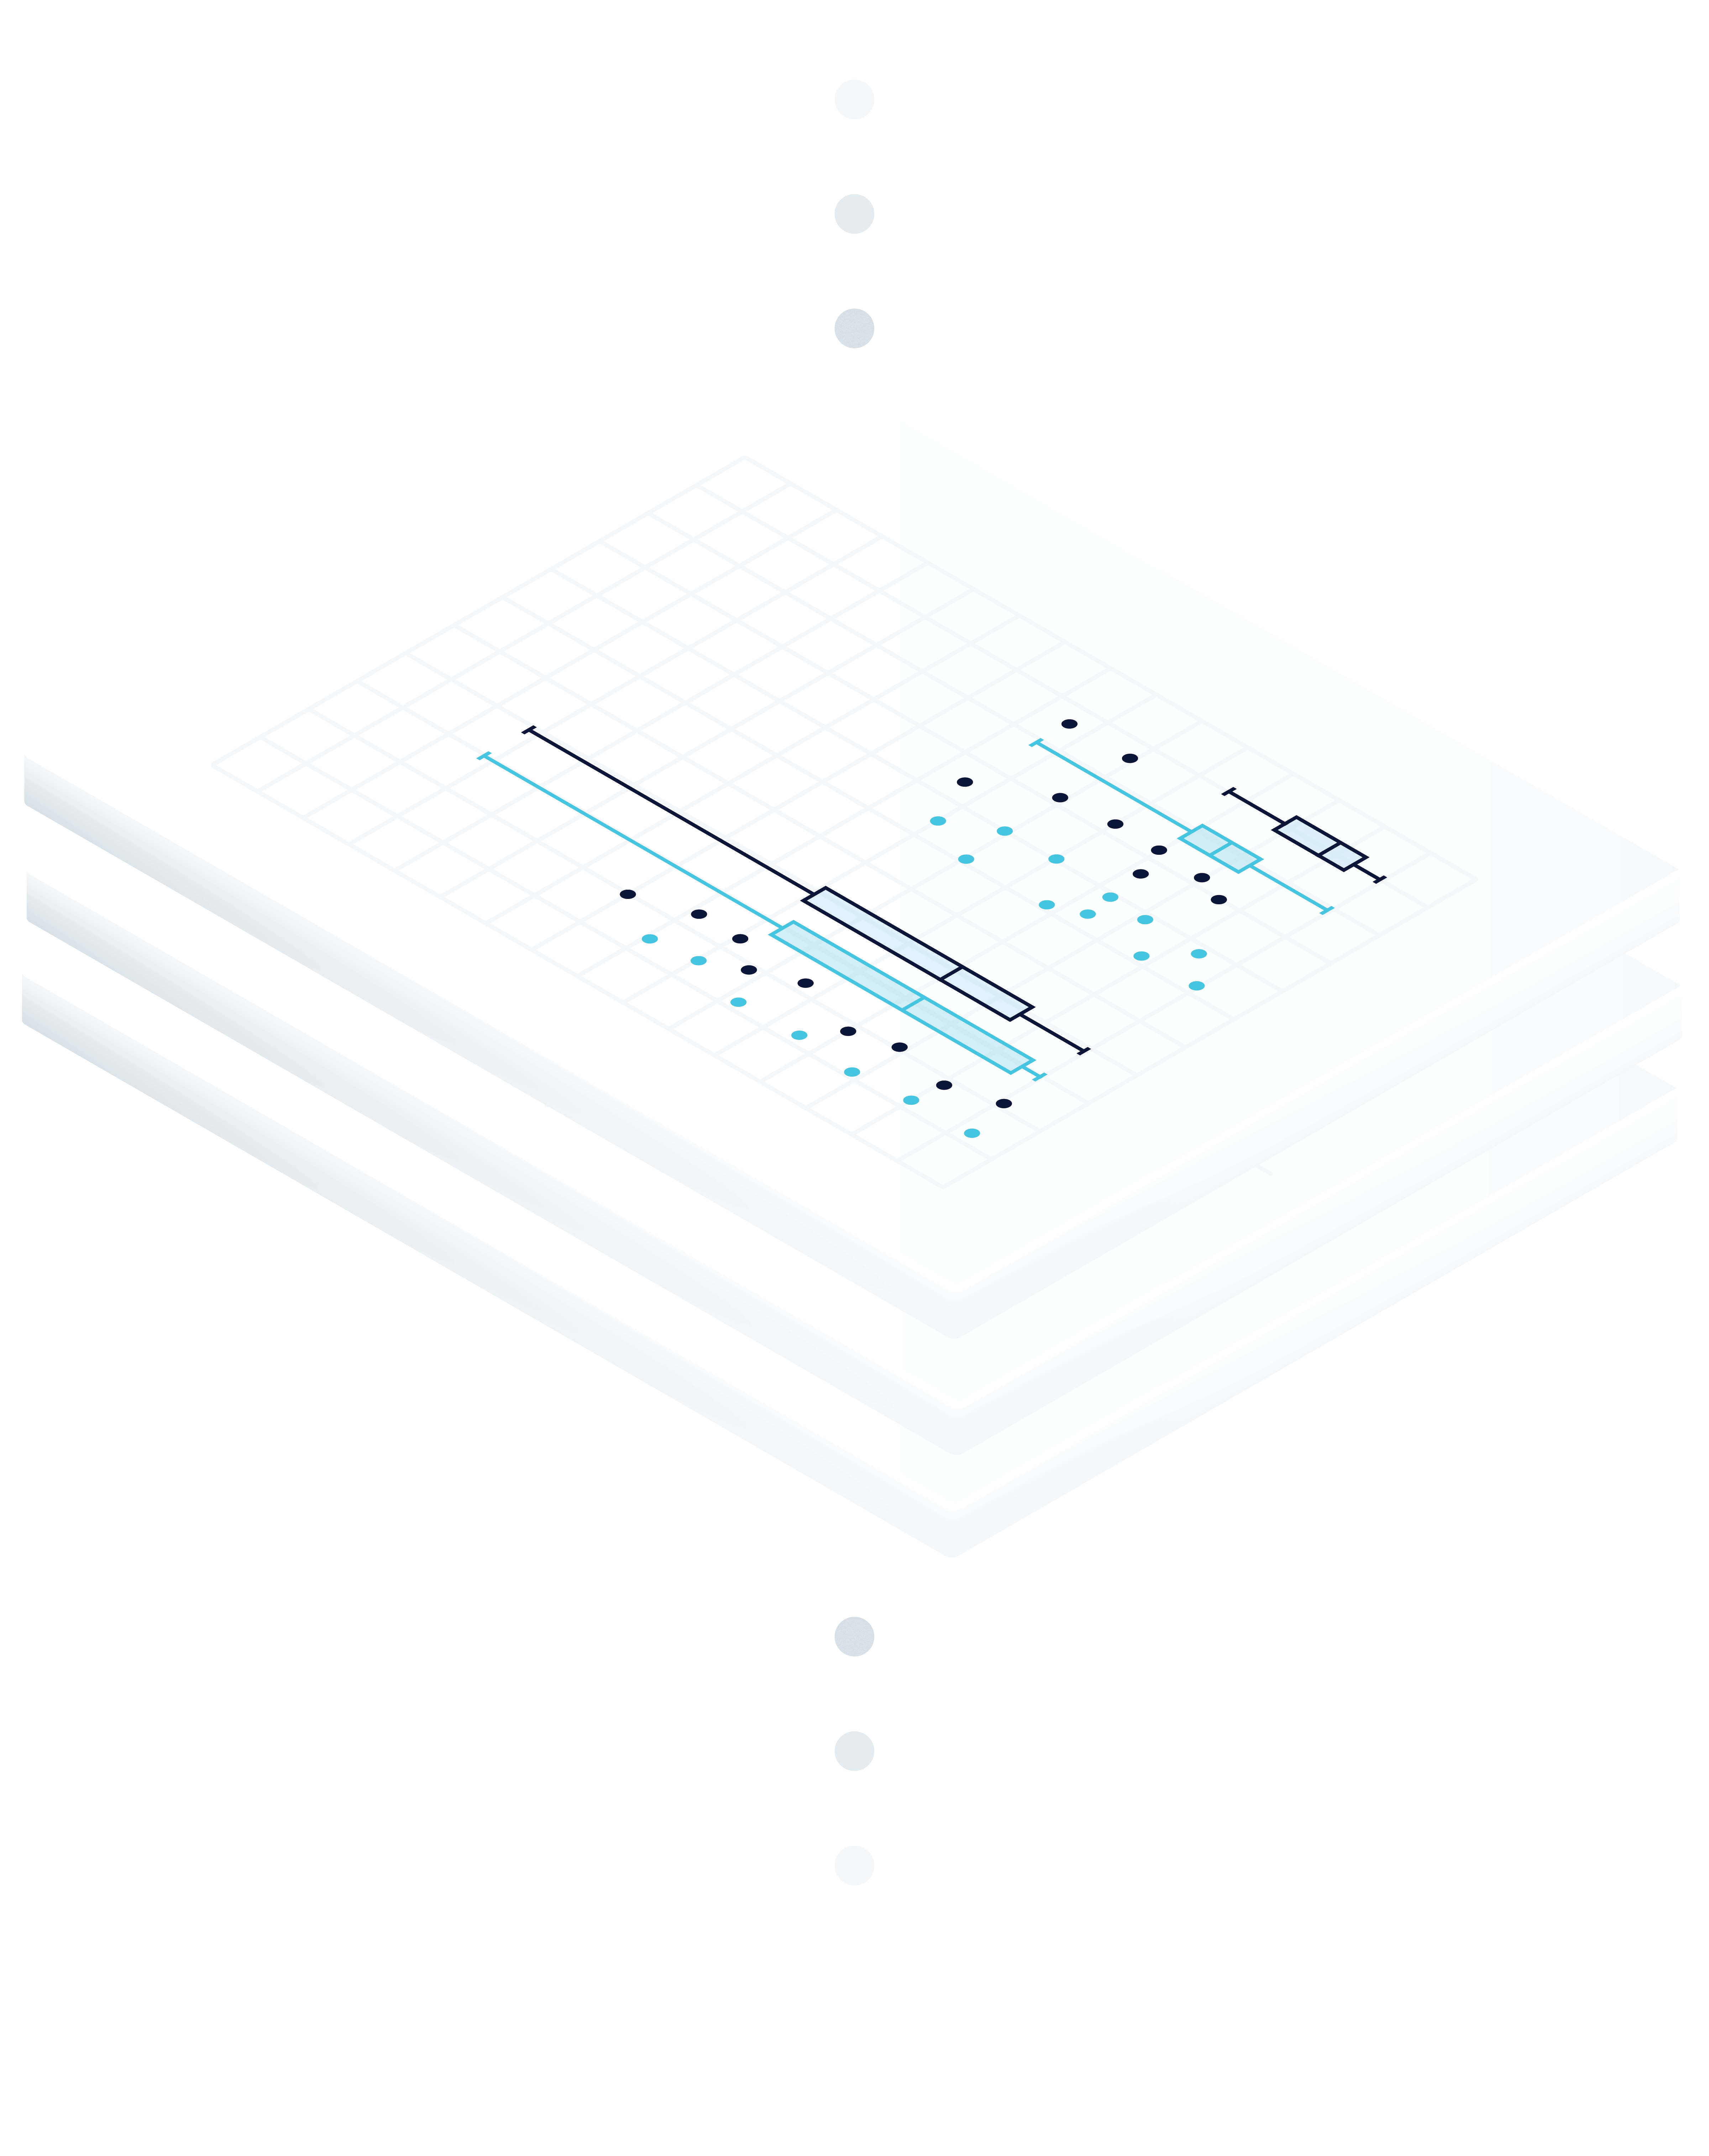
3. Enrich and enhance
Clir combines your data with external renewable energy sources — including 200 GW of industry benchmarking data — to add context to your asset's performance. This improves overall data quality and integrity.

4. Benchmark
With 200 GW of benchmarking data, we compare project performance, health and data against industry peers. This enables context on relative performance and opportunities for optimization.
5. Actionable insights
Our data model — enhanced with market intelligence — enables a deeper understanding of production, lost energy, contractual availability and other KPIs across every asset in your portfolio.

Enriched data to drive results.