Actionable benchmarking insights
Clir has built the largest anonymous dataset of operational solar, and onshore and offshore wind farms. Our benchmarking data offers unparalleled market intelligence, allowing owners to understand and compare asset performance and risk by region, vintage and technology — and giving them the tools and strategies to address issues.
Intelligence throughout the project lifecycle
Our intelligence provides valuable insight into top performing sites and manufacturers, how new technology is performing, where projects are experiencing losses and what optimization opportunities exist. This insight can be leveraged to develop new projects, better operate legacy assets, buy or sell farms, be more competitive in M&A, or for third parties such as tax equity, debt or insurance providers.
Data for informed decision-making
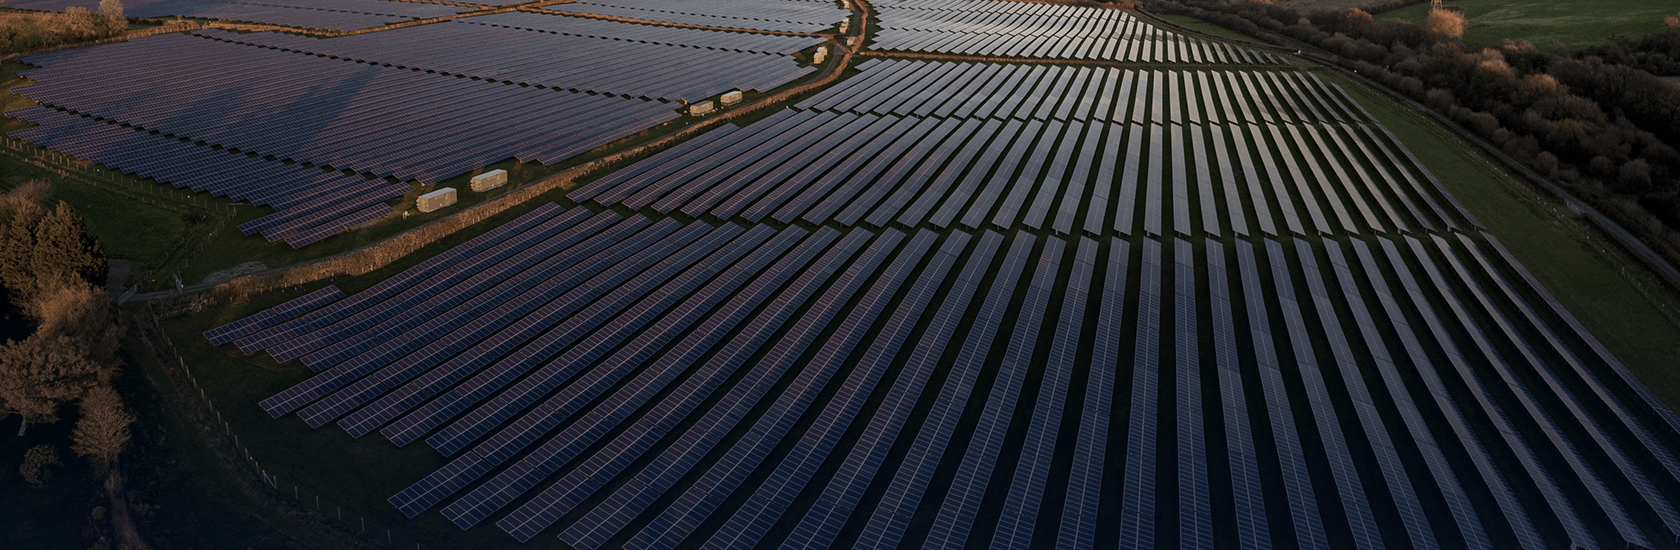
By benchmarking the performance and health of your farm relative to industry peers, Clir can help owners make informed decisions. Performance benchmarks offer context on whether underperformance is normal compared to the industry, enabling improved budget forecasting. With health and risk insights, owners can understand what components may fail. This can help when negotiating the TSA, or planning operations, maintenance and budgets.
Grading health, performance and data
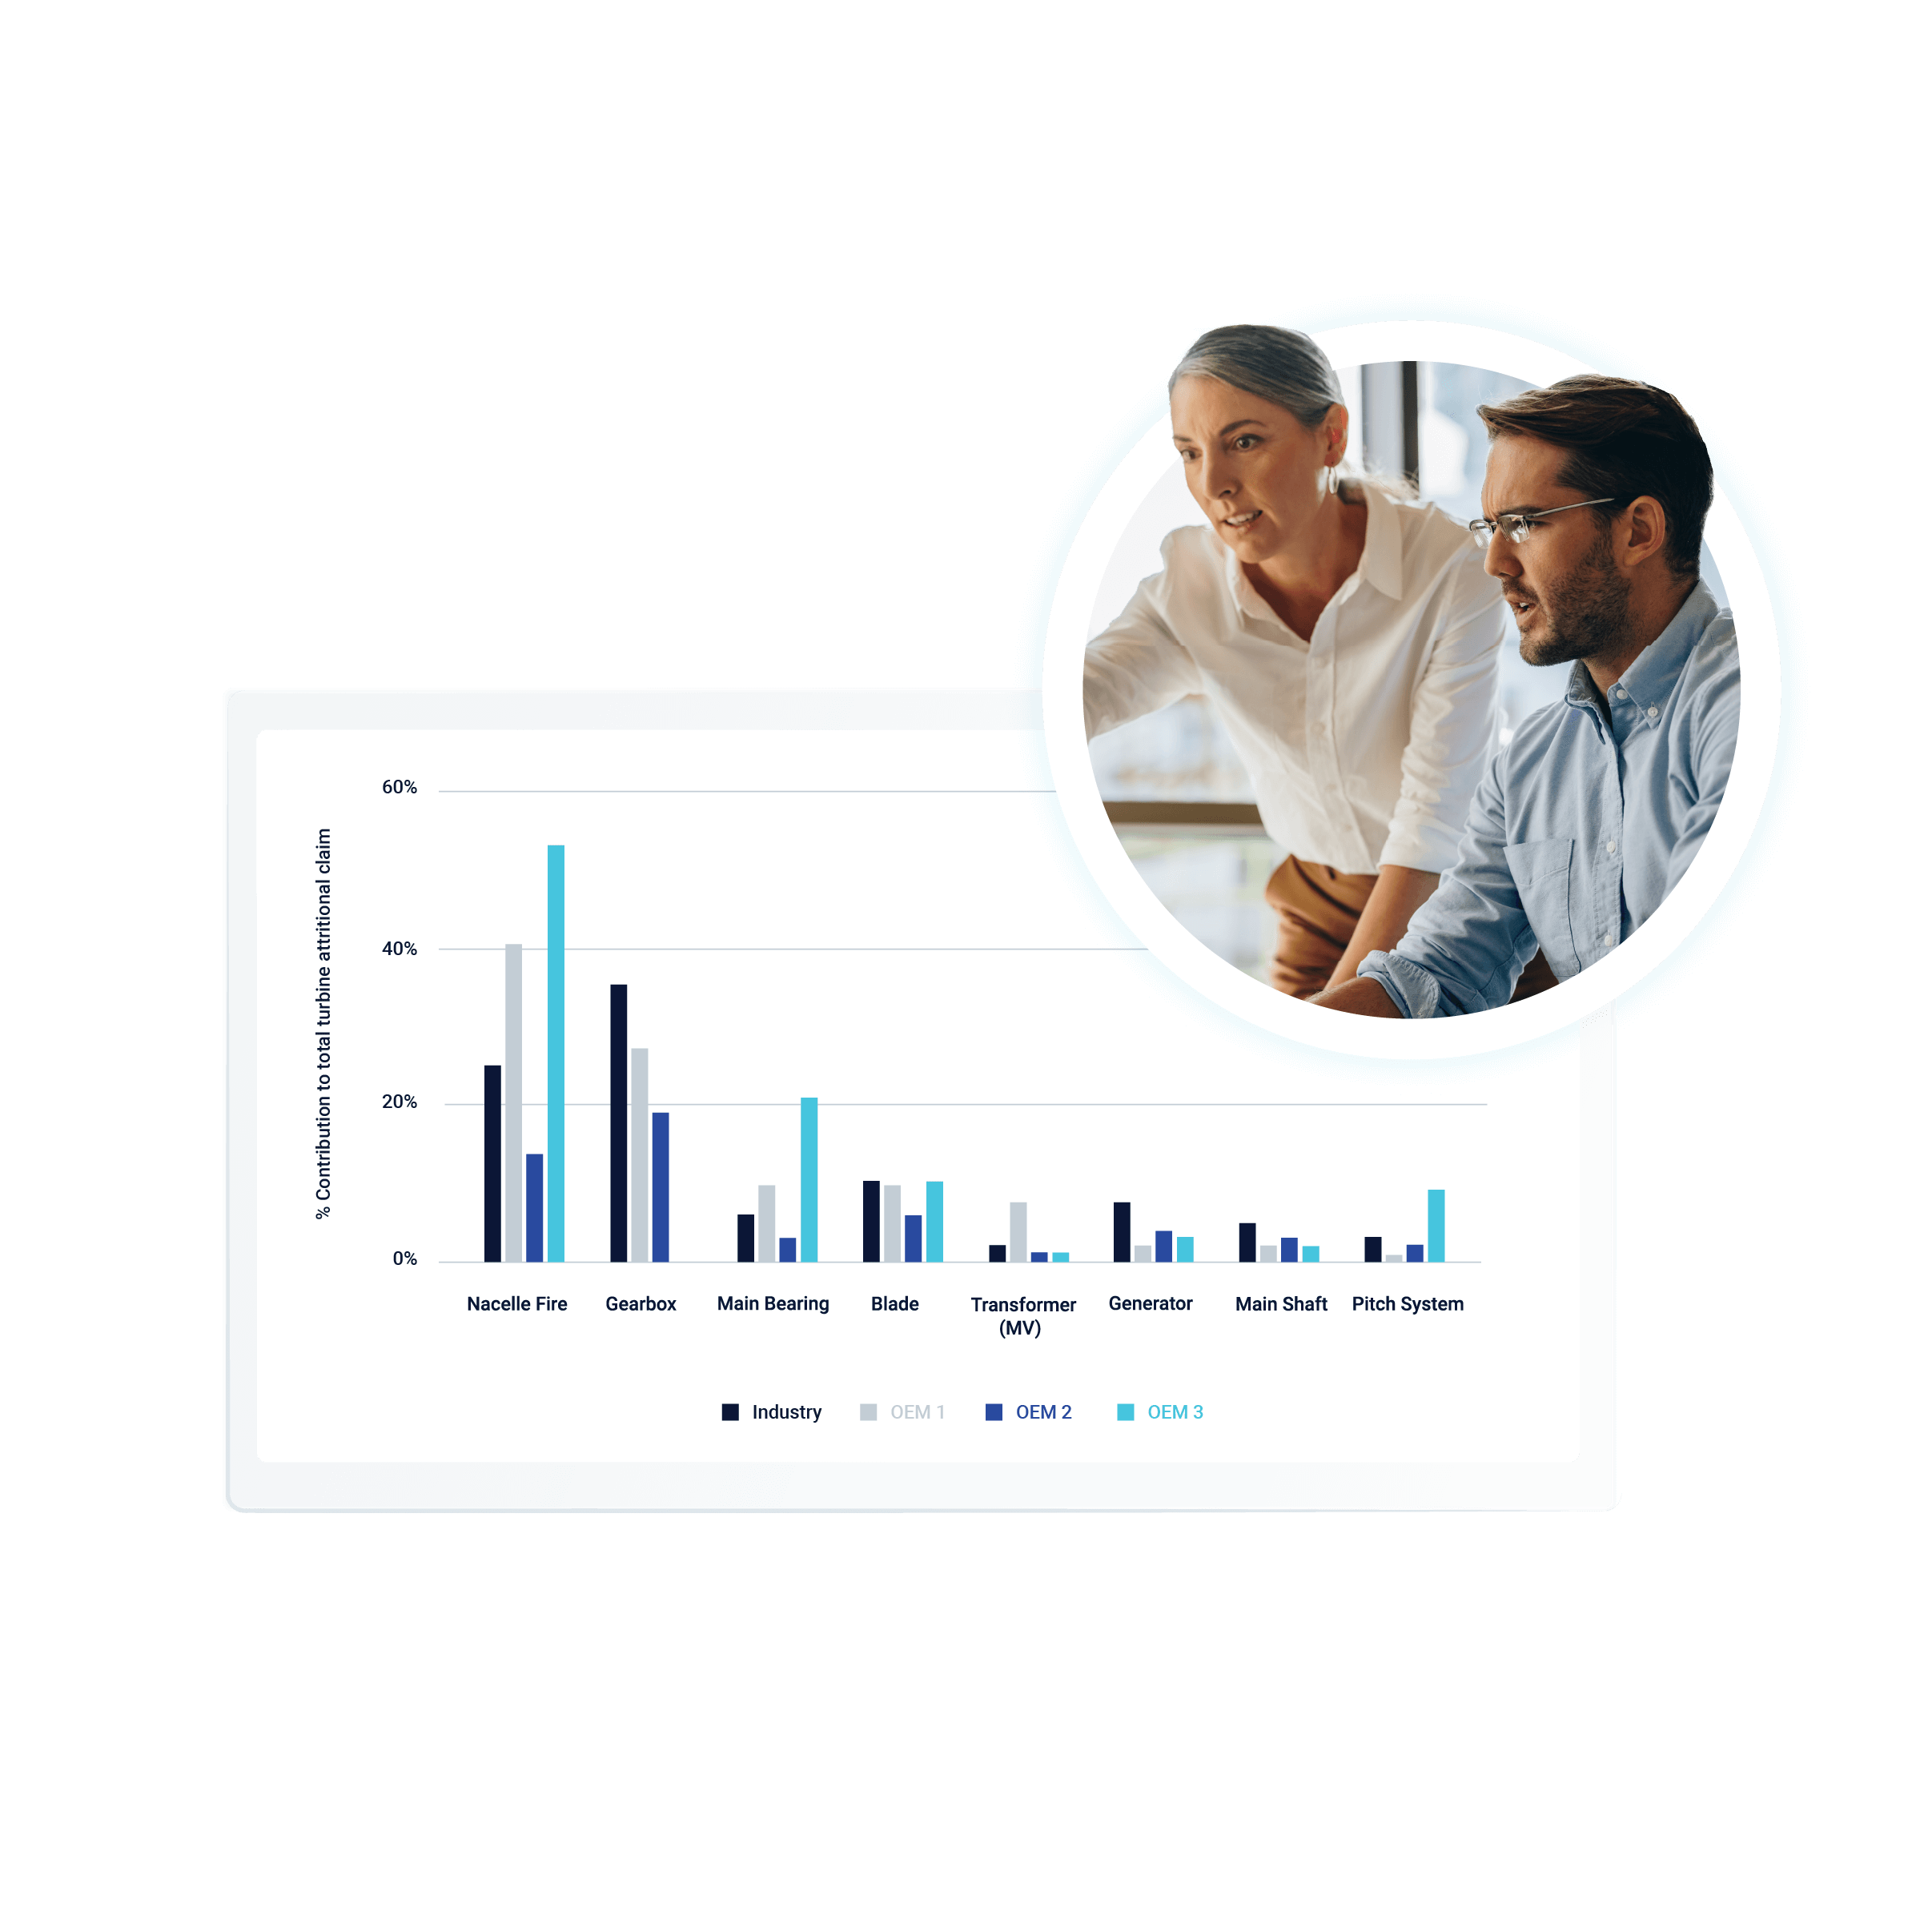
Clir leverages a grading system to provide owners with a snapshot of asset performance, health and data compared to industry peers. These grades, which are provided on an asset and portfolio level, help to identify areas for optimization. Additionally, grading is extended to specific stakeholders associated with each project. Focused on controllable factors, including controllable lost revenue, gains available and degradation, owners can improve performance and reduce risks.
Selecting peer farms
Clir selects peer farms by looking at similar attributes, specifically manufacturer, technology or geographical region. The attributes are weighted differently depending on the KPI that is being benchmarked.

Benchmarking capabilities
Clir’s market insights use the world’s largest operational dataset to benchmark your assets against the industry across a variety of KPIs.
Farm and portfolio performance
- Production
- Capacity factor
- Resource
- Loss factors
- Energy-based availability
- Budget deviation
- Annual production p-value performance
- Loss factors and resource
Service provider and technology
Understanding technology and service provider strengths and weaknesses enables greater transparency and confidence throughout the project lifecycle. It can be leveraged to drive improvements or changes to teams and components.
- Portfolio performance
- Controllable lost energy
- Availability against calendar year
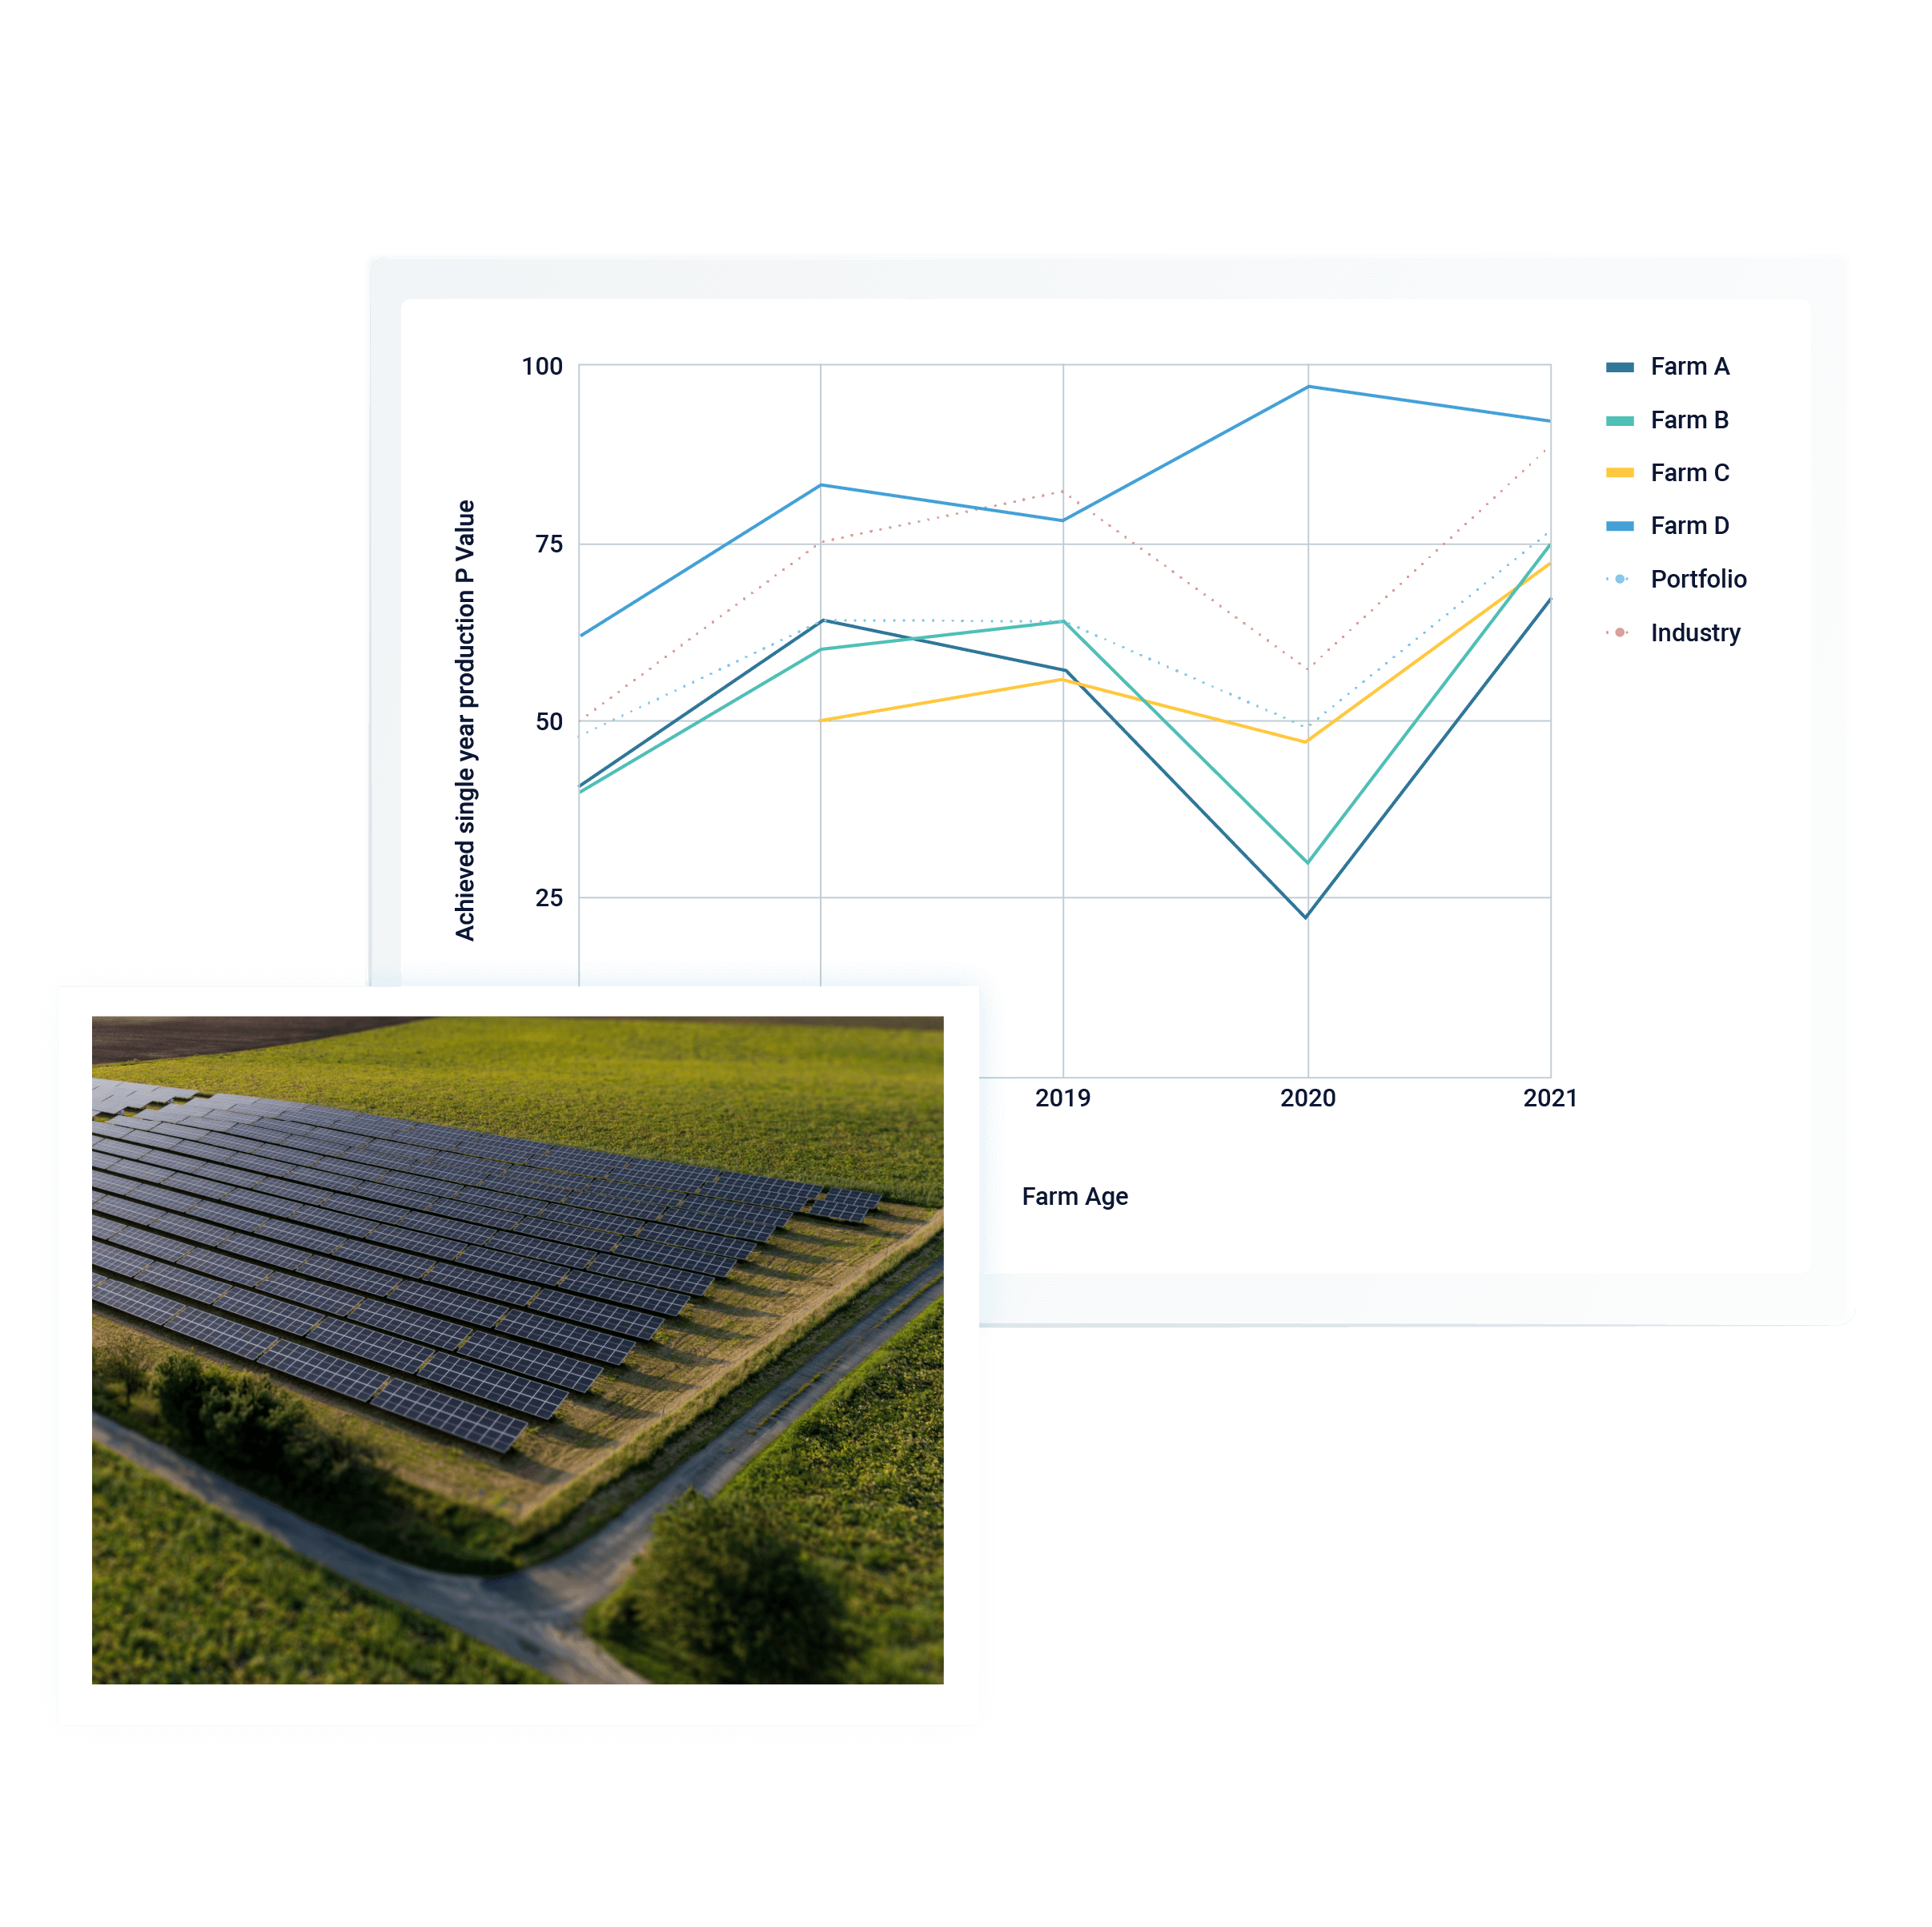
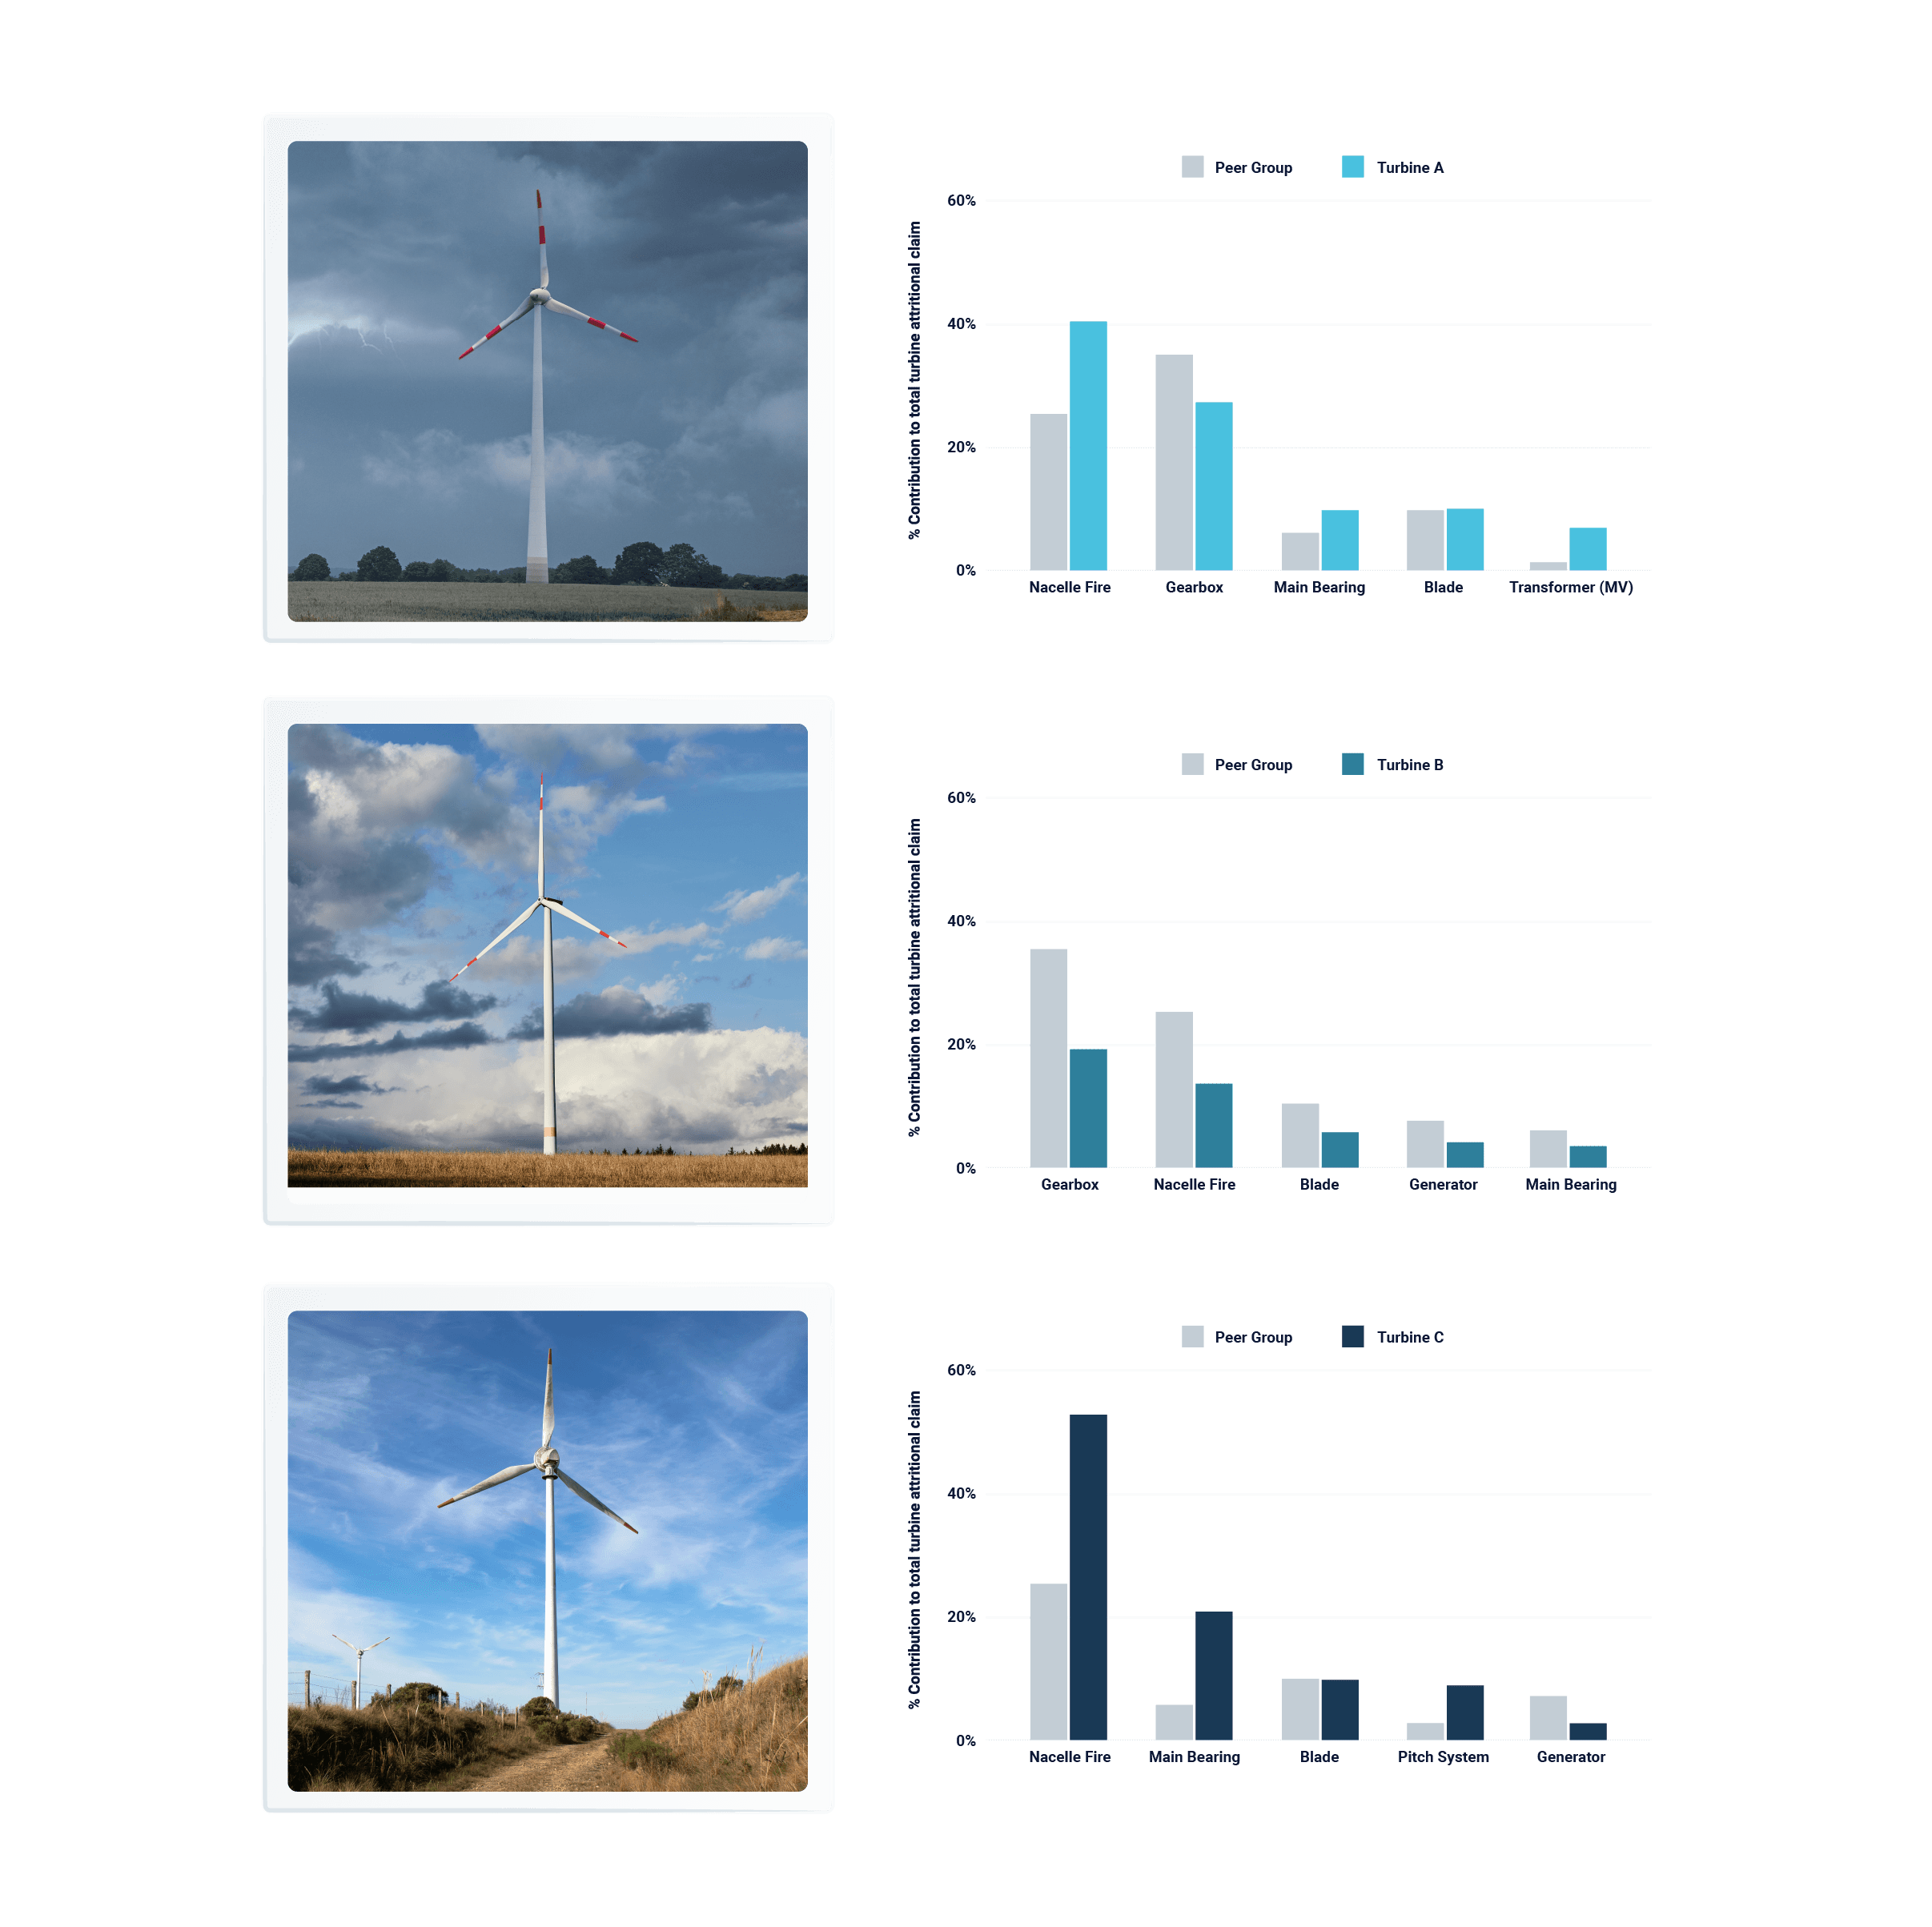
Health and risks
- Potential for catastrophe, supported by data on exposure to natural catastrophe, and known project or technology design flaws.
- Operational loads supported by meteorological conditions (wind only).
- Technology strength, supported by claims and wider industry data.
- Current site health issues, supported by site data.
- Top component risks relative to peers.
- Reliability and downtime frequency.
Performance and energy yield
Clir presents an independent view of the most impactful loss factors being assumed within the energy yield.
- Turbine availability
- Balance of plant availability
- Grid availability
- Hysteresis
- Sub-optimal performance
- Environmental
- Grid curtailment
- Controllable lost energy
- Contractual availability
- Maturity (adoption curve)